How Russians voted in the State Duma election. Part 2
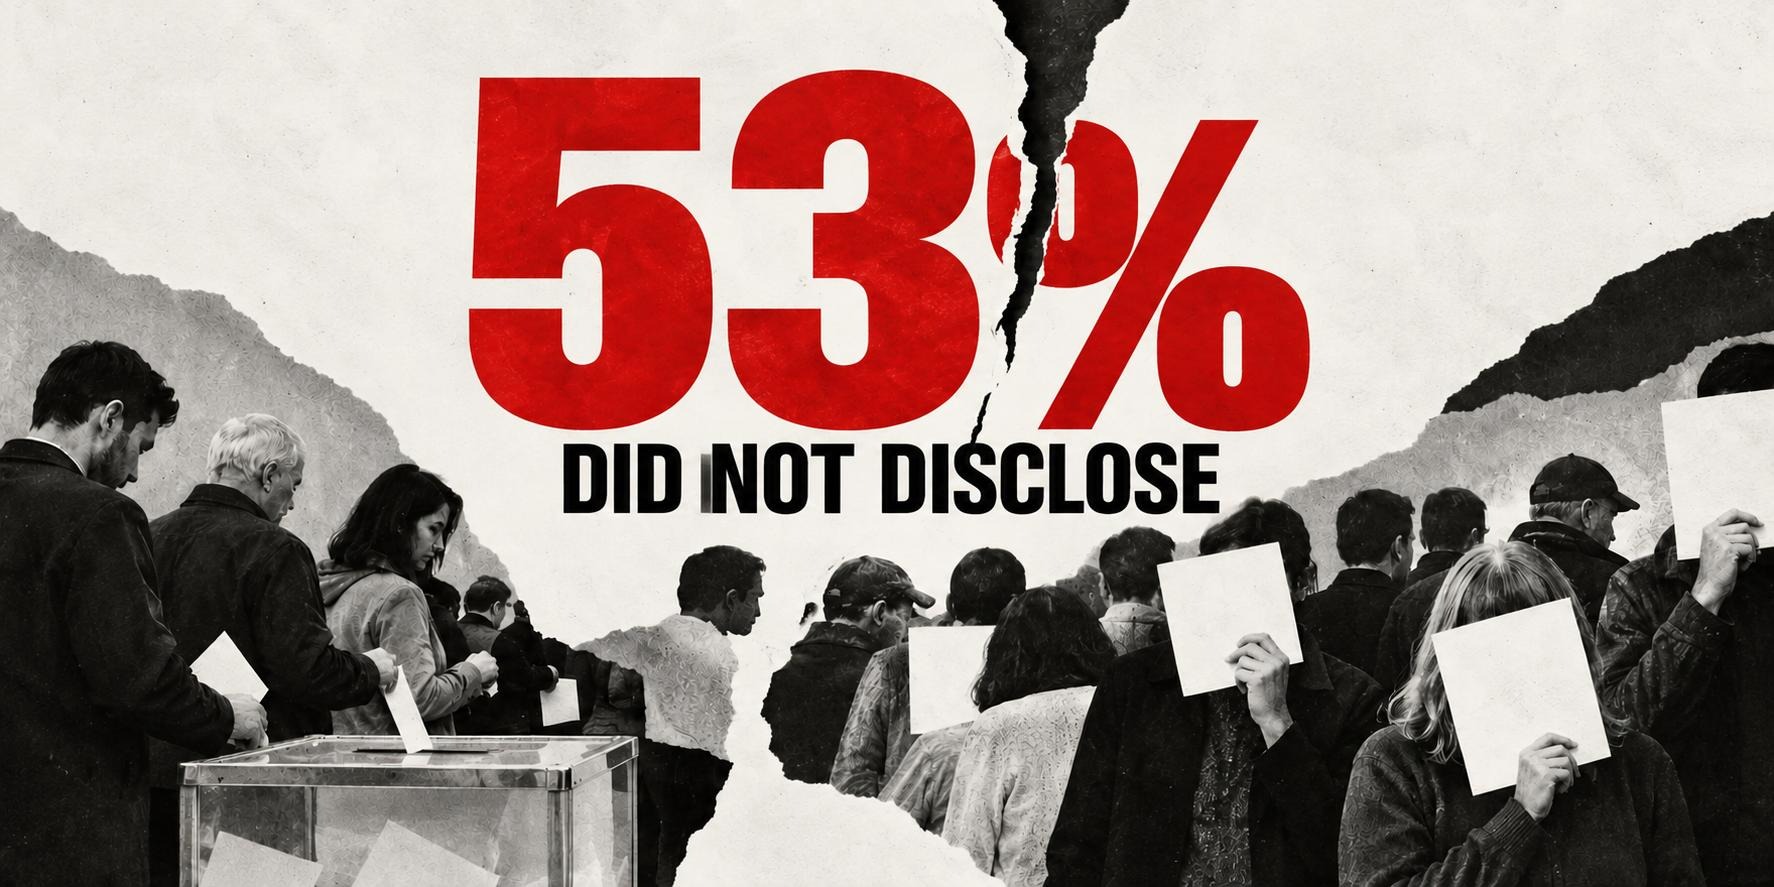
More than half of the Russians who told ExtremeScan on 20 September that they had voted — 53% — did not name the party they voted for. That is far more than in other electoral surveys, including VCIOM's 2026 exit poll. Why the party results of an election-day survey cannot be read as an estimate of the election outcome, what the last pre-election survey shows, and what lesson the monitoring of the 2013 Moscow mayoral election offers.
When non-response is the result
The main research finding of the ExtremeScan survey of 20 September was an unusually high share of voters who did not disclose their party choice.
59% of respondents reported taking part in the election. But among those who said they had voted, 53% did not name the party they voted for. Across the whole sample, that is about 31%.
This is a very high figure. Just a week before the election, in the survey of 4–10 September, 17% of all respondents were unsure or refused to name the party they intended to vote for. On voting day, 31% of all respondents did not name a party. In our survey during the 2024 presidential election, 37% of those who voted did not disclose their choice of candidate.
Willingness to state an intention before an election and willingness to talk about a political act already performed turn out to be quite different things.
How unusual is 53%
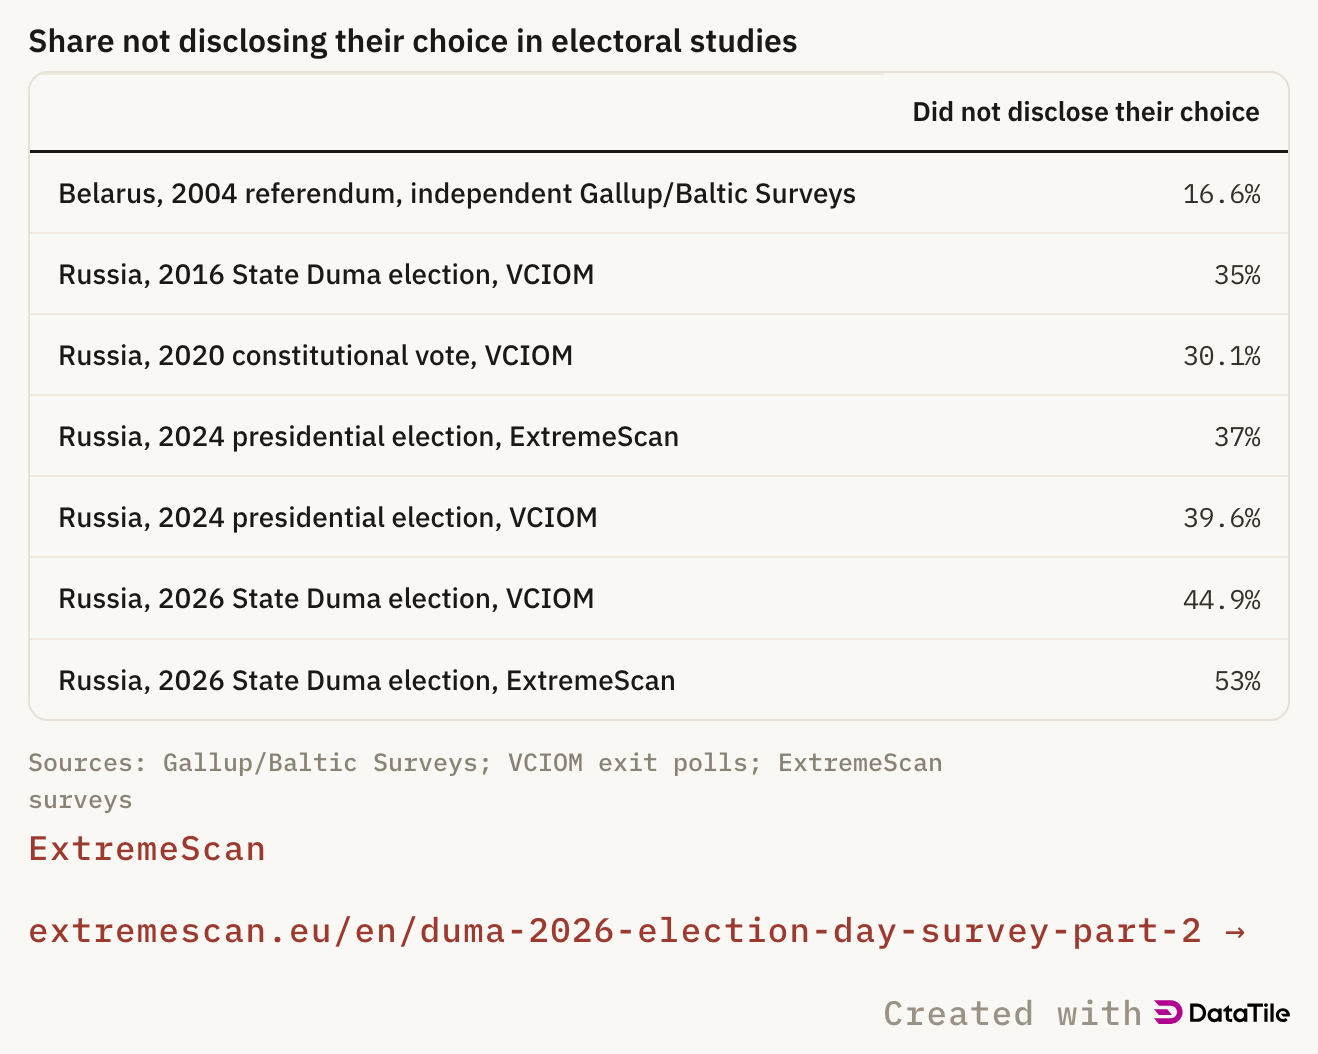
The level of non-disclosure recorded by ExtremeScan — 53% of those who reported voting — is extraordinarily high compared with other electoral studies, including those conducted under limited political competition.
For Belarus in 2004, the independent Gallup/Baltic Surveys reported 16.6% not disclosing their vote; the researchers noted that some respondents were afraid and that the political atmosphere was tense. In VCIOM’s Russian exit polls, 35% did not disclose their choice at the 2016 Duma election, 30.1% in the 2020 vote on constitutional amendments, and 39.6% at the 2024 presidential election.
The VCIOM 2026 figure matters most: 44.9% did not disclose their choice immediately on leaving the polling station.
This is a different type of study, so VCIOM’s 44.9% and ExtremeScan’s 53% cannot be compared directly. One reason for ExtremeScan’s higher figure may be false reporting of participation: a telephone survey, unlike an interview at the exit of a polling station, includes people who may have said they voted without actually doing so. We cannot, however, estimate how much of the gap between the two figures this effect accounts for.
What matters is something else: two different studies, conducted by different organisations with different methods, recorded at the same time an extraordinarily high unwillingness to disclose a political choice already made.
Share not disclosing their choice in electoral studies
| Did not disclose their choice | |
|---|---|
| Belarus, 2004 referendum, independent Gallup/Baltic Surveys | 16.6% |
| Russia, 2016 State Duma election, VCIOM | 35% |
| Russia, 2020 constitutional vote, VCIOM | 30.1% |
| Russia, 2024 presidential election, ExtremeScan | 37% |
| Russia, 2024 presidential election, VCIOM | 39.6% |
| Russia, 2026 State Duma election, VCIOM | 44.9% |
| Russia, 2026 State Duma election, ExtremeScan | 53% |
Embed
Paste this where you want the figure. It resizes itself and always shows the current version.

The question, then, is no longer only who these people voted for, but also why so many of them decided they did not want to talk about it.
What lies behind 53%
We cannot know the motive behind each individual refusal. Most likely, the 53% covers different kinds of behaviour.
One possible reason is the atmosphere of this election: the shrinking space for independent political behaviour, administrative mobilisation, reports of detentions and of observers being removed, of the presence of security forces and of control by employers. All of this may have weakened the subjective sense of a secret ballot — the perception of one’s own political choice as private and protected information.
A stranger’s question, “Which party did you personally vote for?”, may therefore have been heard not as an ordinary survey question but as a request to disclose politically sensitive information.
Another possible explanation for some of the refusals is the well-known turnout overreporting effect: some people say they voted when they did not in fact take part in the election. When the next question asks them to name a specific party, it is easier not to answer than to keep up an invented story.
But that does not appear to account for the 53% in full.
How the refusals sounded
We looked at who exactly did not disclose their choice.
An analysis by demographics, voting day and voting method found no distinct profile for this group. Women were somewhat more likely not to disclose their choice (56% against 49% of men), as were respondents aged 30–49 (61%); people over 60 (42%) and non-working pensioners (45%) were less likely. Differences between public-sector employees, private-sector employees and entrepreneurs, and by voting day and method, are within the margin of error. Overall, this behaviour proved widespread across social groups.
Listening to the interviews was more revealing still.
We listened to about 150 conversations in which respondents did not name a party. The wording varied, but the meaning and tone of the reaction recurred:
- “I don’t want to answer that question.”
- “That’s my private business.”
- “Our vote is secret.”
- “None of your business.”
The interviewer reminded them that the survey is confidential and that answers are analysed only in aggregate. This almost never changed the respondent’s decision. In some conversations it was met with open irritation.
We do not claim that all 53% are protest voters. The refusals may reflect fear, caution, distrust, false reporting of participation, a wish to keep one’s choice secret, and other motives.
But when control over political behaviour is tightening, refusing to disclose one’s choice can itself take on the meaning of an act of disobedience — and, for some respondents, a form of silent resistance.
What the party results of the 20 September survey mean
The high share of undisclosed choices fundamentally changes how the party results of our survey should be read.
59% of respondents said they had taken part in the election. But more than half of them did not name a party.
Recalculated across the whole sample, the answers give:
- United Russia — 12.1%
- Communist Party (KPRF) — 6.3%
- New People — 3.6%
- LDPR — 2.7%
- A Just Russia — 1.3%
- other parties — under 1% each.
As a result, only 12.1% of the whole sample reported both voting and voting for United Russia. This is not an estimate of the party’s real electoral support — it is the share of those who told us they made that choice.
Meanwhile, 21% said they would not vote, 17% had not yet voted at the time of the interview, and about 31% did not disclose their party choice.
We do not know how party preferences or non-participation are distributed within this 31%. We have no grounds to assume they are distributed the same way as among those who agreed to name their vote.
The 20 September survey cannot be a reliable tool for reconstructing the full party distribution of the vote, as exit pollsters routinely do. In Russian conditions, whether someone refuses to name a party is quite likely to depend on the party or political position itself. Mechanically redistributing the non-responses among parties would therefore be wrong.
What the pre-election survey shows
For a proper comparison of our data with the election results, ExtremeScan’s last pre-election survey, conducted on 4–10 September, becomes especially important.
It measured not an action performed but an electoral preference: which party a person intends to vote for.
At that point, those unsure or refusing to name a party made up 17% of all respondents; on voting day, 31% of all respondents (53% of those who voted). This survey therefore gives a much fuller picture of the structure of party preferences on the eve of the vote.
We have been here before.
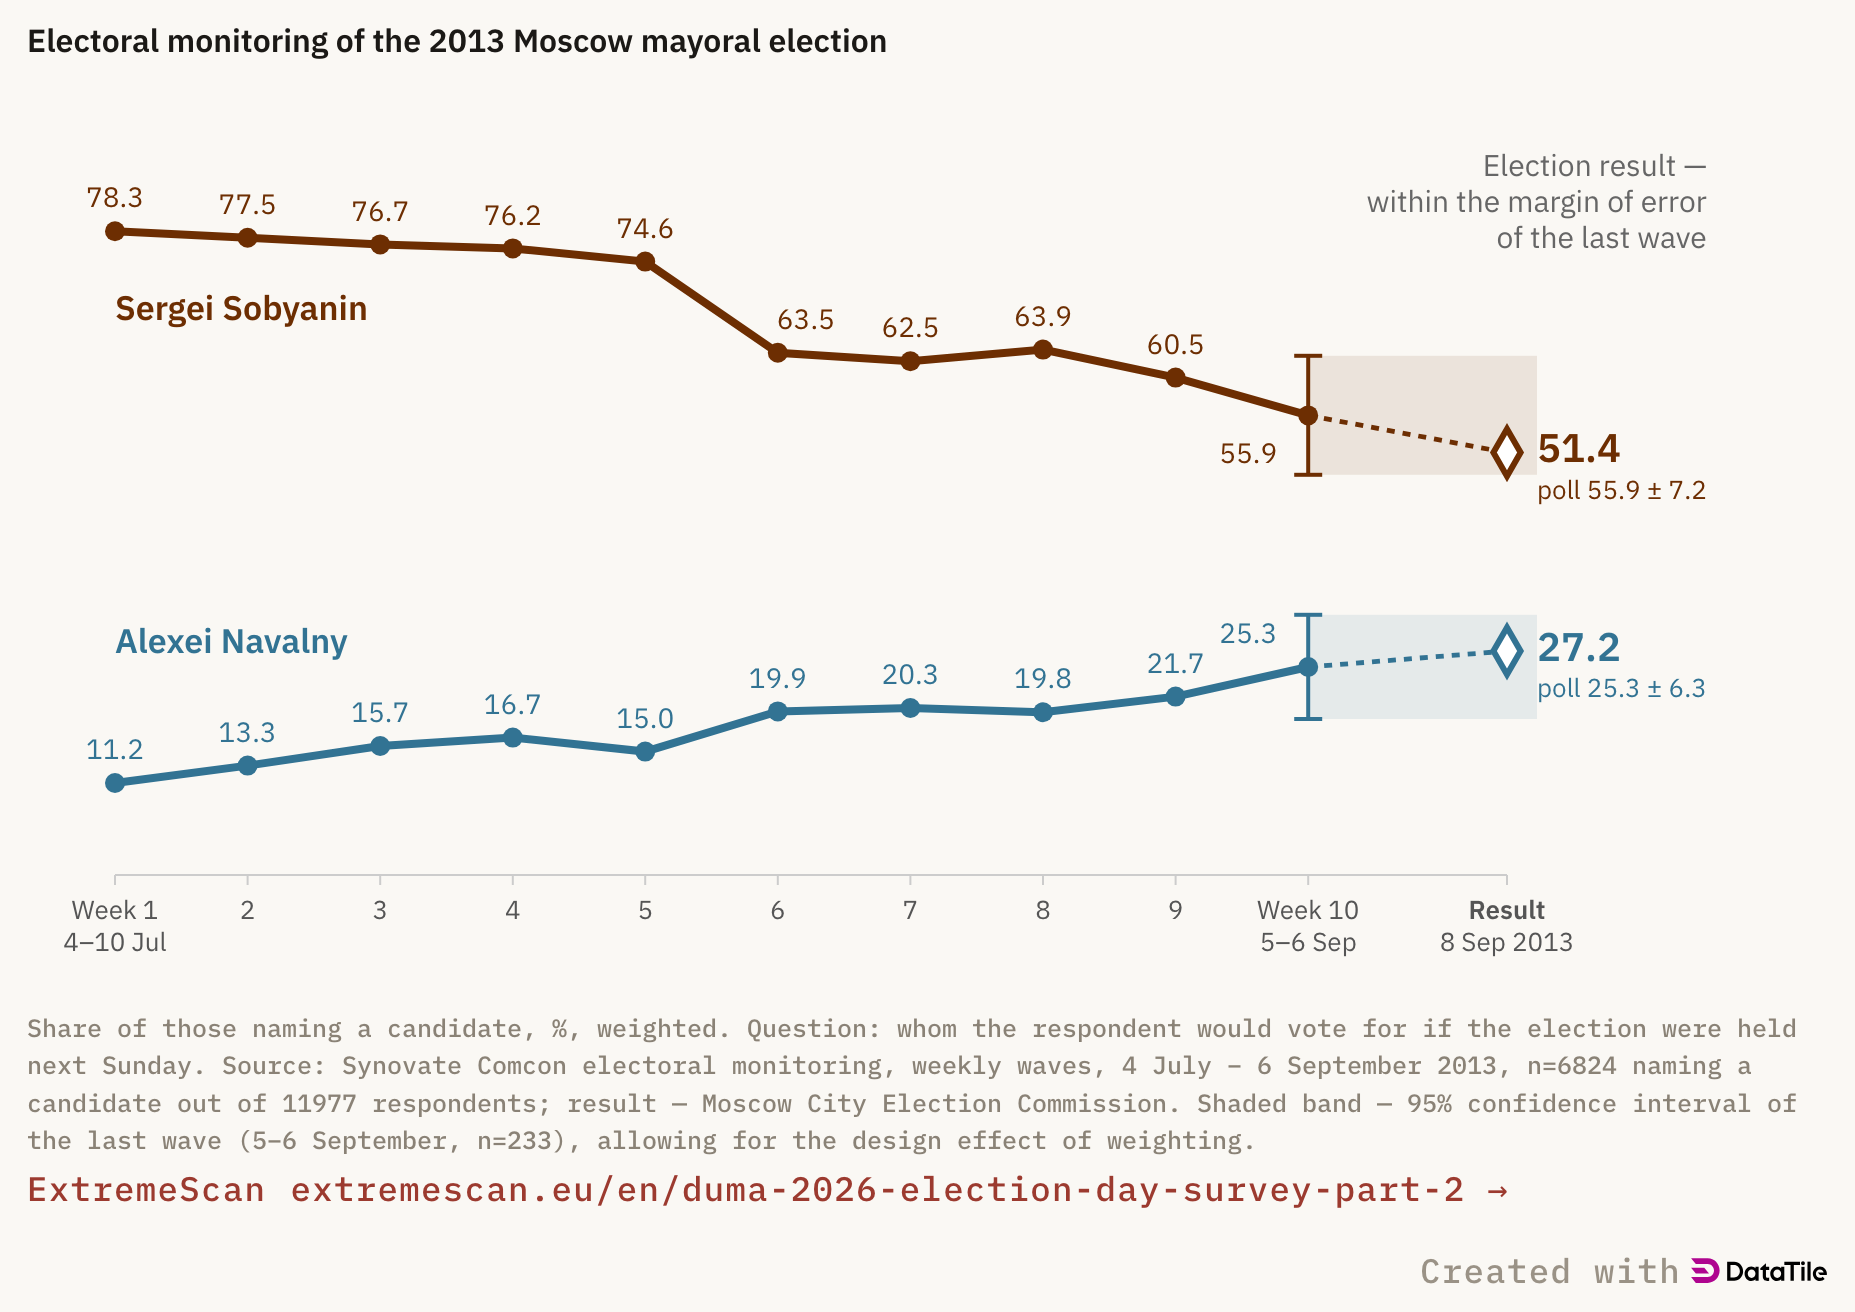
In the 2013 Moscow mayoral election, the last pre-election wave of Synovate Comcon’s monitoring, conducted as close to voting day as possible and read together with the trend of the previous waves, proved the most accurate basis for estimating the real balance of electoral preferences.
Electoral monitoring of the 2013 Moscow mayoral election
Embed
Paste this where you want the figure. It resizes itself and always shows the current version.
For us this experience matters not only historically. It showed the value of an independent series of measurements, especially when the public picture of an election is otherwise shaped mainly by state pollsters and by occasional, far less frequent independent surveys.
The political and electoral environment of 2026 is fundamentally different from Moscow in 2013. But the methodological lesson holds: the last pre-election survey and a survey taken after voting are not necessarily two competing estimates of the same indicator.
In our case they measured different things.
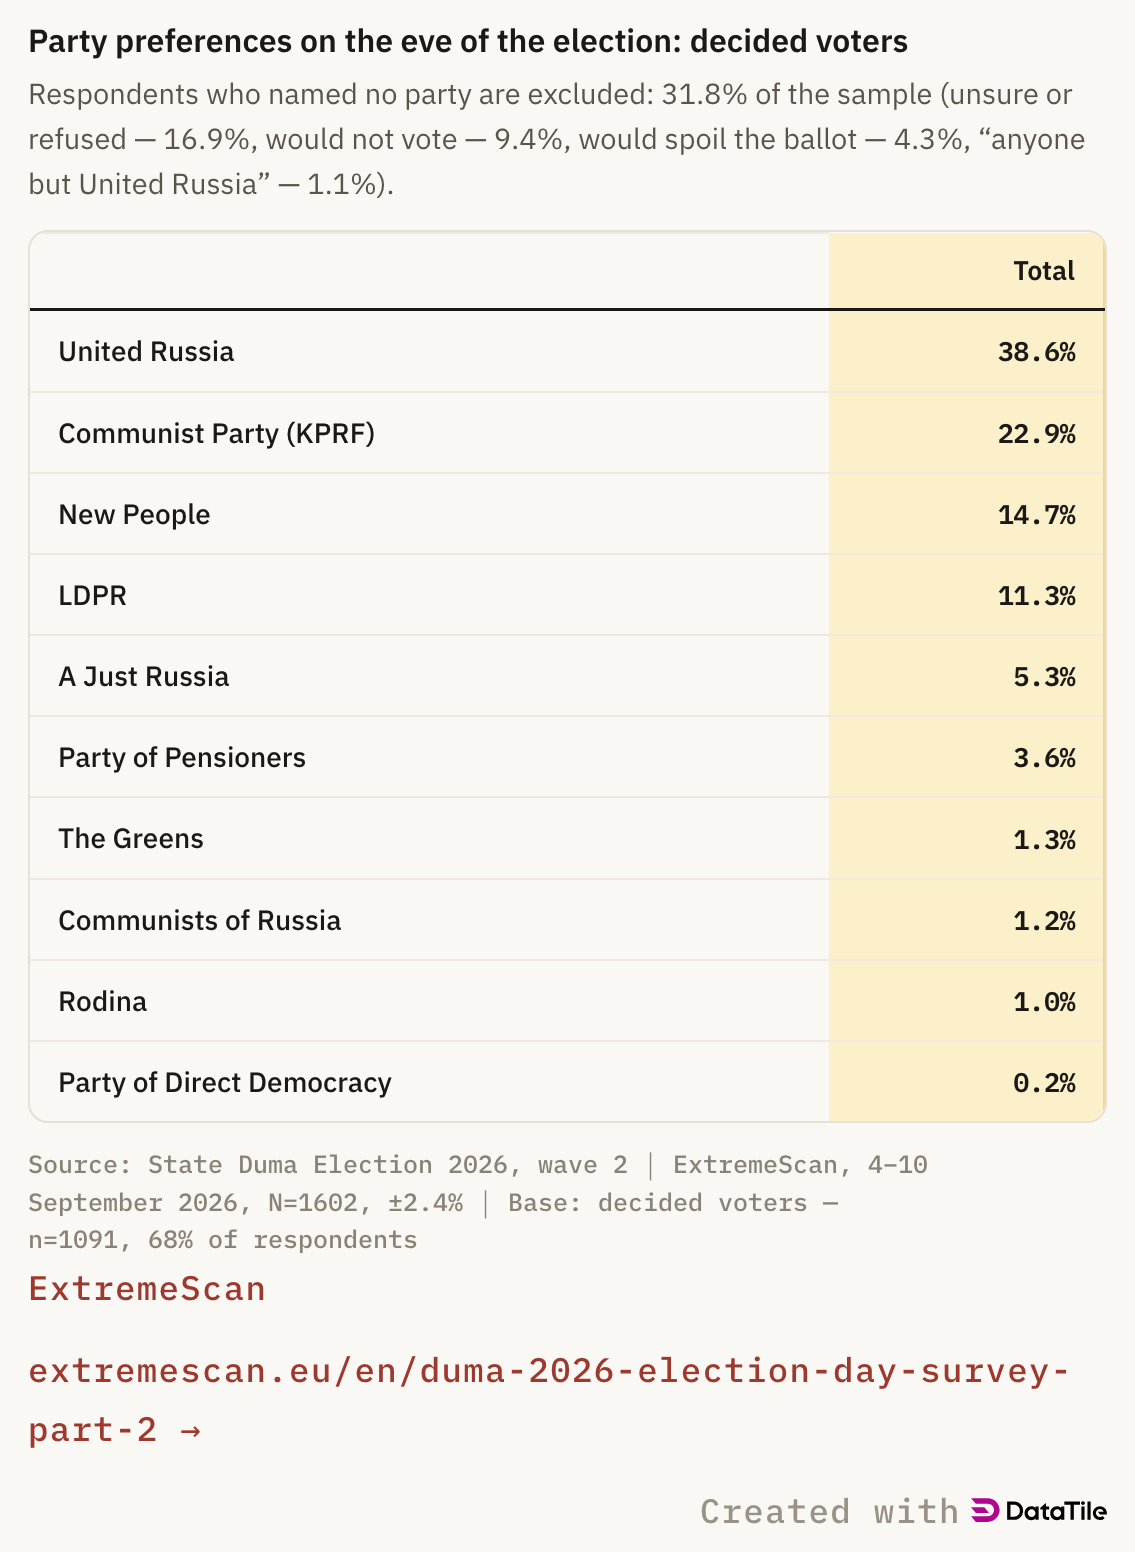
The 4–10 September survey shows the structure of political preferences on the eve of the vote. These figures can be compared with the official election results and with pollsters’ forecasts.
Party preferences on the eve of the election: decided voters
Respondents who named no party are excluded: 31.8% of the sample (unsure or refused — 16.9%, would not vote — 9.4%, would spoil the ballot — 4.3%, “anyone but United Russia” — 1.1%).
| Total | |
|---|---|
| United Russia | 38.6% |
| Communist Party (KPRF) | 22.9% |
| New People | 14.7% |
| LDPR | 11.3% |
| A Just Russia | 5.3% |
| Party of Pensioners | 3.6% |
| The Greens | 1.3% |
| Communists of Russia | 1.2% |
| Rodina | 1.0% |
| Party of Direct Democracy | 0.2% |
Embed
Paste this where you want the figure. It resizes itself and always shows the current version.
The 20 September survey shows what happened to the expression and disclosure of these preferences once people found themselves inside the actual electoral process.
What we have learned
The main result of the 20 September study is not a pointless attempt to guess any party’s official percentage.
The study uncovered something more complex: political preference, participation in the vote and willingness to disclose a choice already made turned out to be three different forms of electoral behaviour.
Before the election, most respondents were willing to talk about their party preferences.
During the election, the conditions of participation differed substantially between groups of voters and between voting days.
And after voting — actual or declared — a huge share of voters treated their own choice as information they did not want to disclose.
We do not know who these people voted for.
But we know something else: they did not want to tell us.
And that anomaly says something about the state of society in itself.
At 53%, this is not missing data.
It is new knowledge.