How Russians voted in the State Duma election
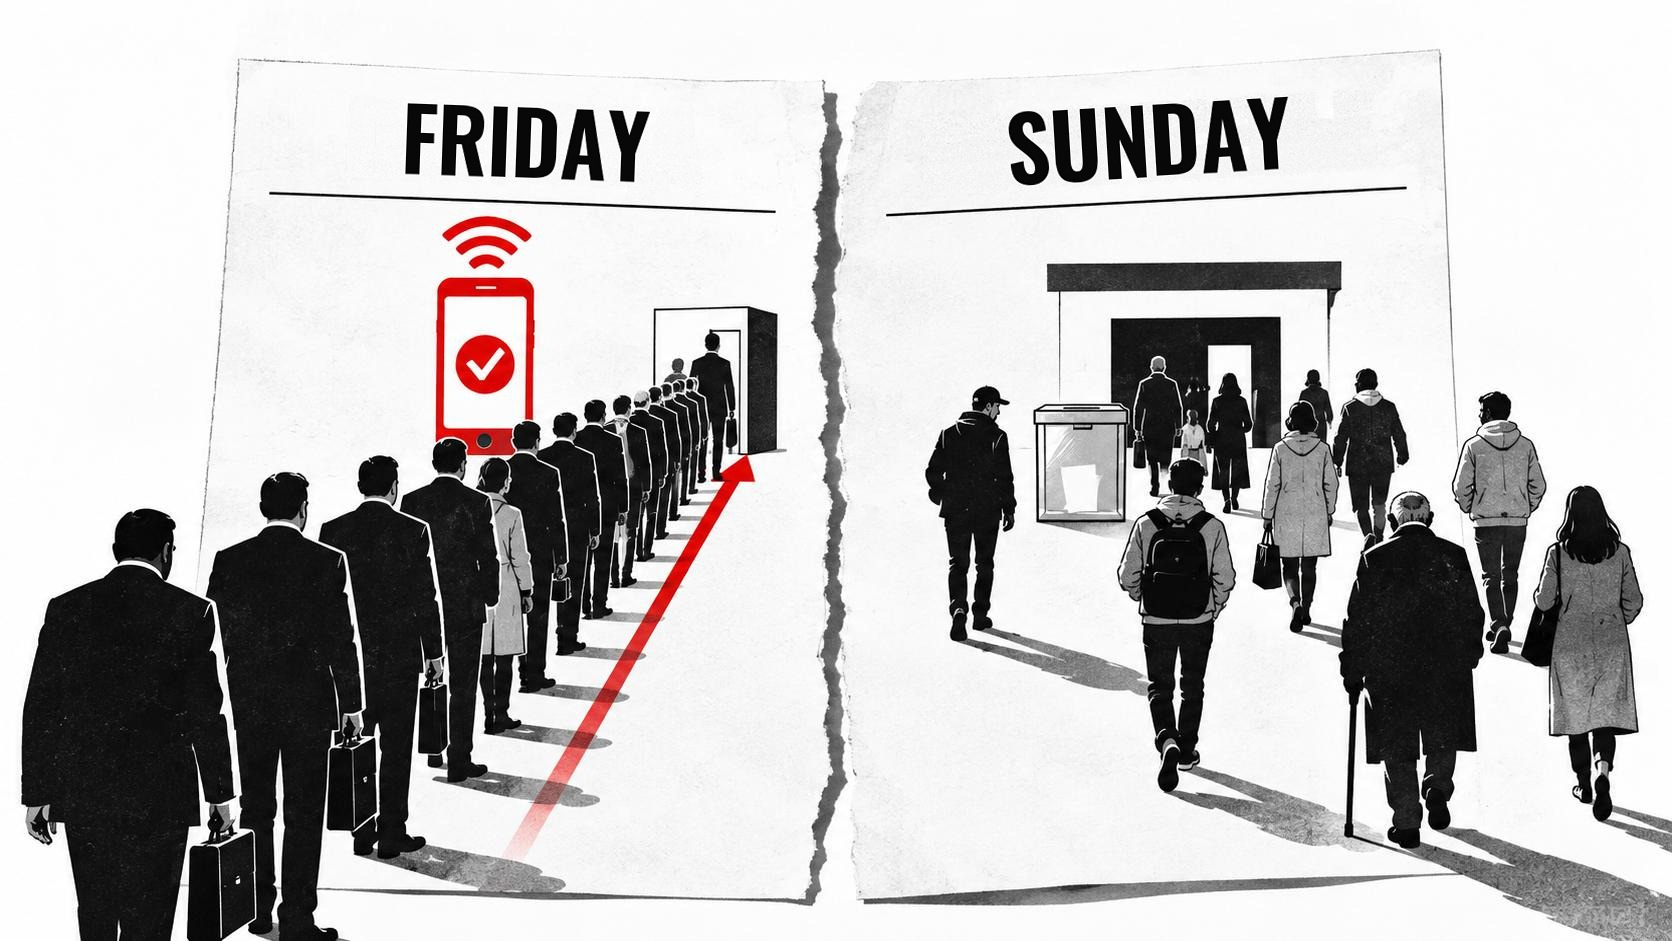
An ExtremeScan telephone survey on the last voting day, 20 September 2026: 1640 respondents, 980 of whom had already voted. Who voted, on which day and by what means; which party people say they voted for and how many refuse to say; whether voters expect an honest count. The main result is two electorates divided by the calendar: Friday belonged to the state sector, online voting and United Russia, Sunday to polling-station voters, the private sector and the protest vote.
On 20 September 2026, the last of three voting days, the research group ExtremeScan conducted a nationwide telephone survey of Russian residents about their participation in the State Duma election. 1640 adults were interviewed between 08:00 and 20:46 Moscow time, while polling stations in most regions were still open.
The study continues the approach ExtremeScan used during the presidential election in March 2024, when 4000 residents were interviewed on the second and third voting days.
As in 2024, we do not call this study an exit poll in the strict sense. An exit poll interviews voters as they leave the polling station. We survey the population by telephone and record what people report about actions they have already taken. The study is therefore not designed to estimate official turnout or to reproduce the official result. Its task is different: to see electoral behaviour directly on the days of the vote. Who voted, on which day and by what means; which party people say they voted for and how many are willing to say so; whether voters expect an honest count.
Participation
59% of respondents said they had already voted. 17% had not yet voted but intended to do so the same day; 21% said they would not vote.
This figure cannot be read as turnout. As the 2024 study showed, people who took part in the election agree to an interview about voting more readily than those who did not, and the sample shifts towards voters. Since the subsequent questions were asked only of those who had voted, this bias does not affect the rest of the data.
Participation rises steadily with age: from 46% among 18–29-year-olds to 67% among those aged 50 and over. The young have always been the most likely to stay away.
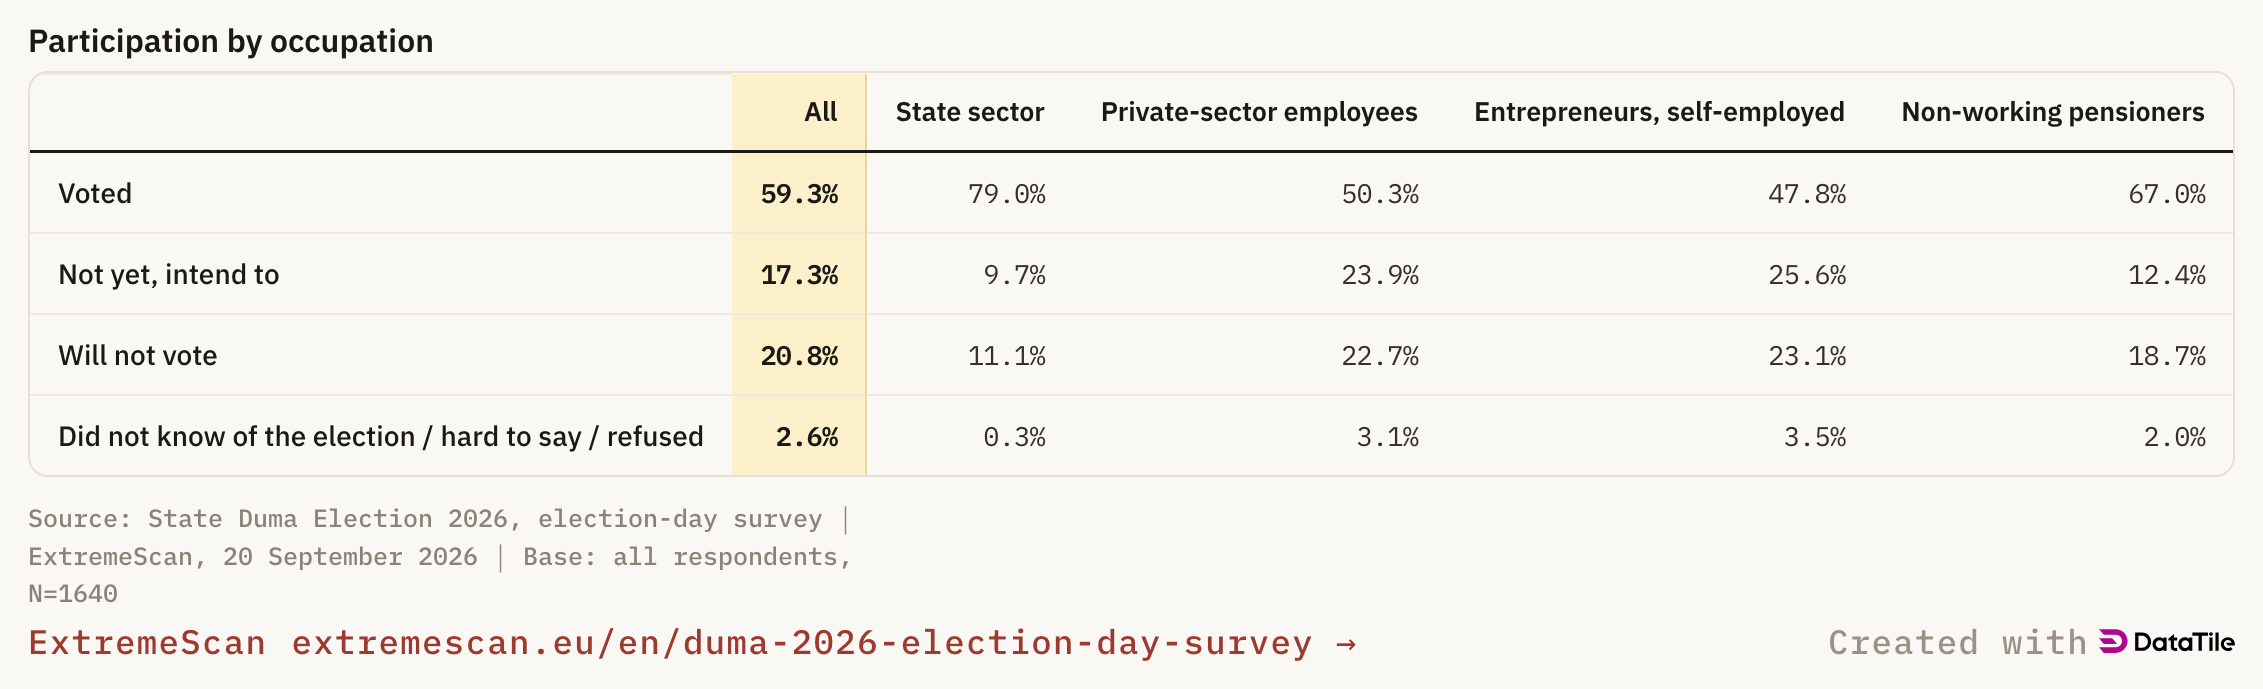
The sharpest difference is by occupation. 79% of employees of state enterprises and institutions reported voting, against 50% of private-sector employees and 48% of entrepreneurs and the self-employed. In 2024 the corresponding figures were 90% and 73%: the gap has widened further.
Participation by occupation
| All | State sector | Private-sector employees | Entrepreneurs, self-employed | Non-working pensioners | |
|---|---|---|---|---|---|
| Voted | 59.3% | 79.0% | 50.3% | 47.8% | 67.0% |
| Not yet, intend to | 17.3% | 9.7% | 23.9% | 25.6% | 12.4% |
| Will not vote | 20.8% | 11.1% | 22.7% | 23.1% | 18.7% |
| Did not know of the election / hard to say / refused | 2.6% | 0.3% | 3.1% | 3.5% | 2.0% |
Embed
Paste this where you want the figure. It resizes itself and always shows the current version.

How people voted
74% of voters voted at a polling station, 8% at home and 17% remotely, online. In 2024 these shares were 81%, 6% and 12%: remote electronic voting has grown by almost half. In regions where online voting was available, 32% of voters used it.
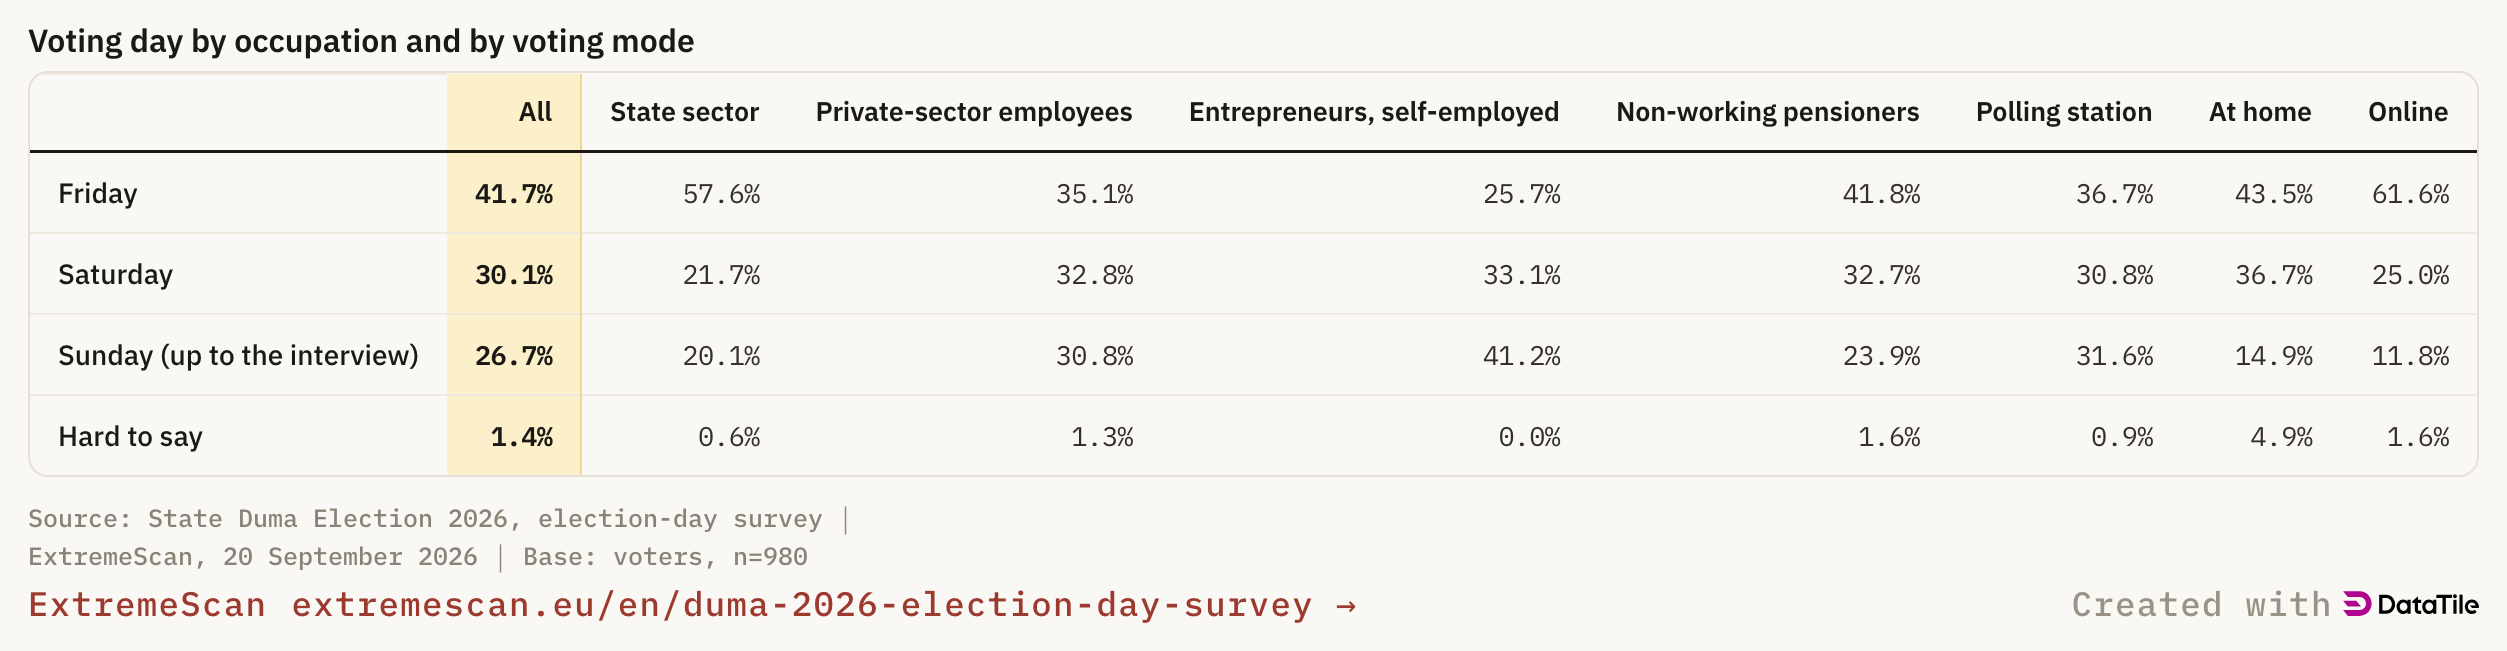
By day, the vote was distributed as follows: Friday 42%, Saturday 30%, Sunday (up to the time of the interview) 27%.
Behind the averages are two very different pictures. State-sector employees voted early: 58% of them voted on Friday, against 35% of private-sector employees and 26% of entrepreneurs and the self-employed. Online voters were early too: 62% of electronic votes were cast on Friday, against 37% of polling-station votes. By Sunday the picture had reversed: 88% of Sunday voters went to a polling station, and entrepreneurs and the self-employed were the group most likely to vote on that day, at 41%.
Voting day by occupation and by voting mode
| All | State sector | Private-sector employees | Entrepreneurs, self-employed | Non-working pensioners | Polling station | At home | Online | |
|---|---|---|---|---|---|---|---|---|
| Friday | 41.7% | 57.6% | 35.1% | 25.7% | 41.8% | 36.7% | 43.5% | 61.6% |
| Saturday | 30.1% | 21.7% | 32.8% | 33.1% | 32.7% | 30.8% | 36.7% | 25.0% |
| Sunday (up to the interview) | 26.7% | 20.1% | 30.8% | 41.2% | 23.9% | 31.6% | 14.9% | 11.8% |
| Hard to say | 1.4% | 0.6% | 1.3% | 0.0% | 1.6% | 0.9% | 4.9% | 1.6% |
Embed
Paste this where you want the figure. It resizes itself and always shows the current version.
In 2024 we called the concentration of state-sector voting on Friday, then 60%, unique. It has recurred: 58% in 2026. And it has acquired a second channel. Electronic voting is the most “Friday” of all modes, and, as the section on administrative pressure shows, it was state-sector employees who were told to register for it.
Which party people voted for, and how many are willing to say
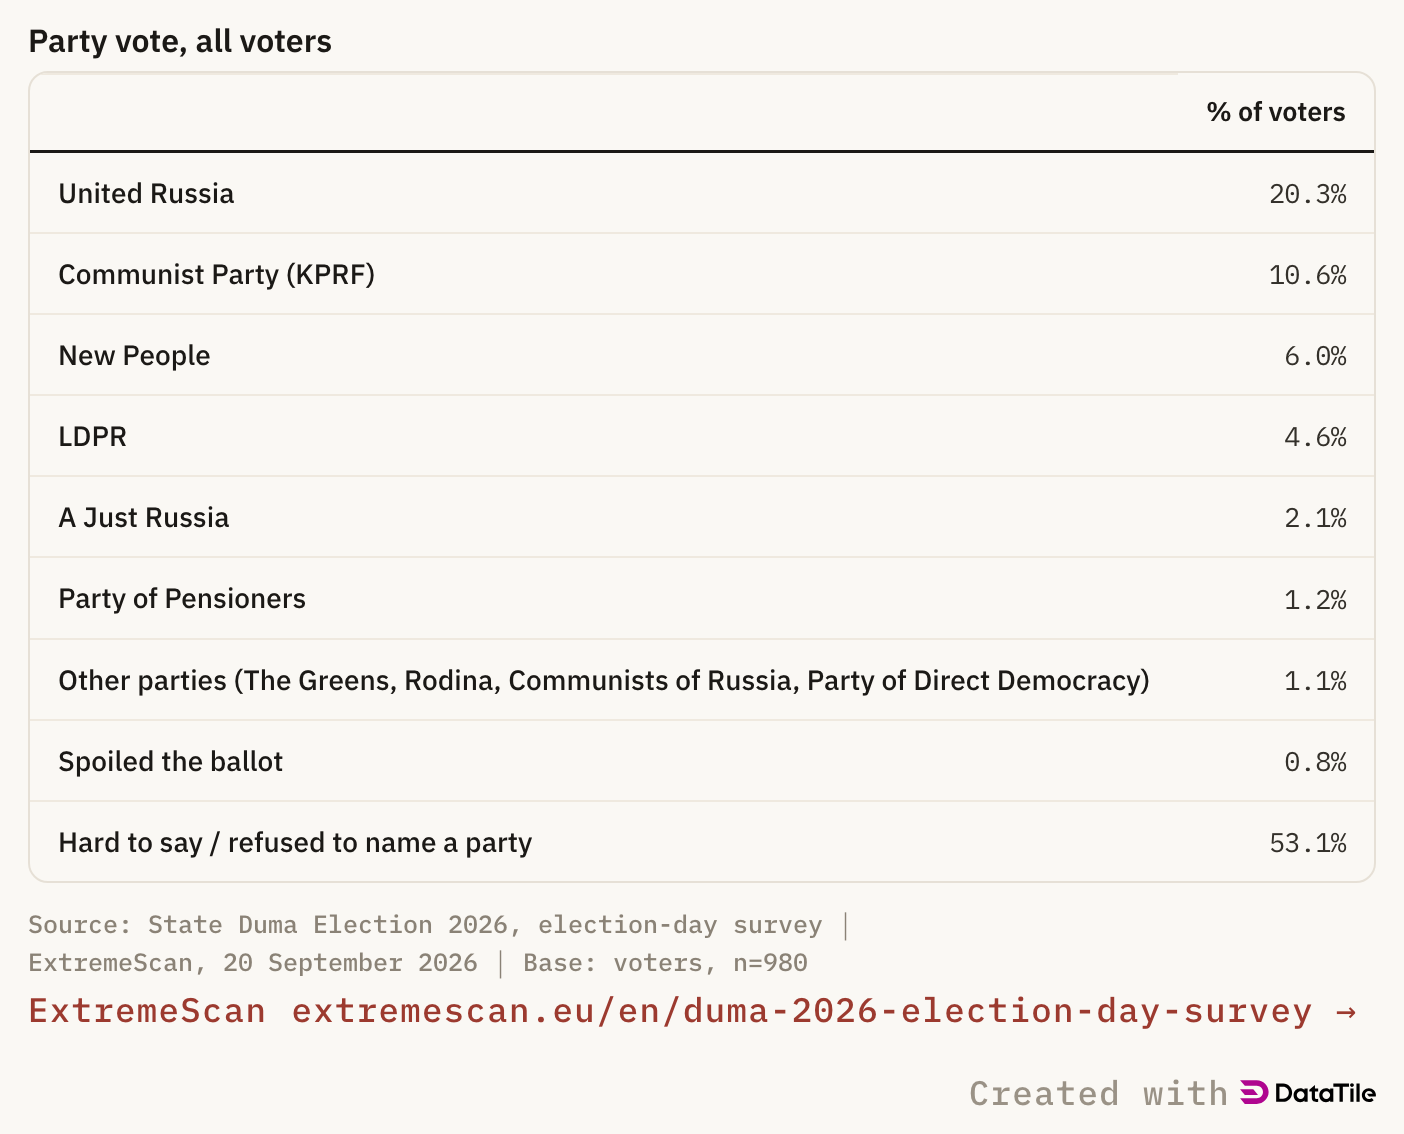
Voters were asked: “And which party did you personally vote for?” The options were read out only when necessary; those who refused were reminded that the survey is confidential.
Party vote, all voters
| % of voters | |
|---|---|
| United Russia | 20.3% |
| Communist Party (KPRF) | 10.6% |
| New People | 6.0% |
| LDPR | 4.6% |
| A Just Russia | 2.1% |
| Party of Pensioners | 1.2% |
| Other parties (The Greens, Rodina, Communists of Russia, Party of Direct Democracy) | 1.1% |
| Spoiled the ballot | 0.8% |
| Hard to say / refused to name a party | 53.1% |
Embed
Paste this where you want the figure. It resizes itself and always shows the current version.
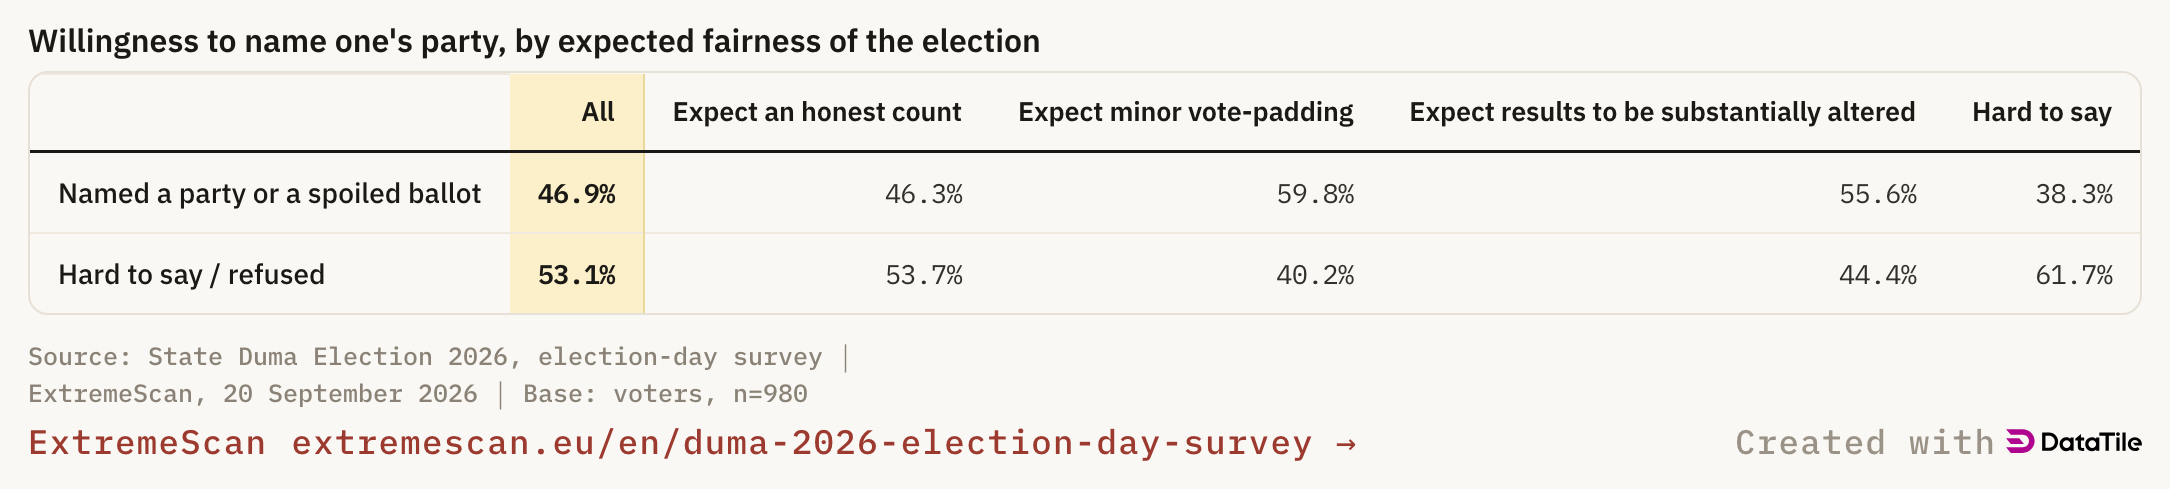
More than half of voters, 53%, would not say whom they had voted for. In March 2024, 37% of voters refused to name a candidate. Before the election, in the survey of 4–10 September, 17% could not or would not name a party: willingness to state an intention and willingness to state an act already committed are two very different things.
We do not recalculate these figures “among those who answered” as a vote estimate, and we do not redistribute refusals. The main lesson of 2024 is that those who refuse to disclose their choice are not a random part of the electorate. In 2024 refusal was markedly higher among the audience of non-state media, and we modelled the refusers as concealed opposition voters. In 2026 this indicator no longer separates supporters and opponents of the authorities as clearly as it did in 2024: 48% of federal-TV viewers refused, as did 50% of the non-state media audience.
Refusing to disclose a choice: fear, caution or resistance?
What may have happened
One possible reason is the atmosphere of this election itself. Compared with the 2024 presidential election, this campaign ran amid a further narrowing of the space for independent political behaviour: the only openly anti-war party was excluded from the ballot, and corporate mobilisation intensified. Over the three days of voting, independent observers and media reported detentions at polling stations themselves, the removal of observers, the presence of police and other security forces, restrictions on access to polling stations and monitoring by employers. These reports do not allow the scale of such practices across the country to be assessed, but they characterise the context in which a voter answered a question about a choice already made.
Such conditions could lower the subjective sense that the ballot is secret. Someone who had just seen police, cameras or conflicts with observers at a polling station, or who had faced an employer’s demand to report on taking part or to register for electronic voting, might hear an unfamiliar interviewer’s question — “Which party did you personally vote for?” — not as an ordinary sociological question but as a request for politically sensitive information. The point is not whether the secrecy of the ballot held technically, but how far the voter felt their political choice was private and protected.
There is another, probably less significant, explanation for part of the refusals. Electoral research knows the effect of turnout over-reporting well: people who did not vote sometimes report that they did, since voting is socially approved civic behaviour. But the next question requires naming a specific party. Some respondents who reported taking part when in fact they had not may have preferred to refuse an answer rather than keep up an invented story.
When a non-answer becomes political behaviour
We do not know what lies behind each of these non-answers. But the 53% itself speaks of an important change: for the majority of the voters who spoke to us, party choice turned out to be information they did not want, or were not able, to report. For some it may have been fear, for others caution, for others an unwillingness to keep up an invented story about taking part, and for some a plain “none of your business”. The last, amid growing control over electoral behaviour, can itself become a form of passive resistance.
Willingness to name one's party, by expected fairness of the election
| All | Expect an honest count | Expect minor vote-padding | Expect results to be substantially altered | Hard to say | |
|---|---|---|---|---|---|
| Named a party or a spoiled ballot | 46.9% | 46.3% | 59.8% | 55.6% | 38.3% |
| Hard to say / refused | 53.1% | 53.7% | 40.2% | 44.4% | 61.7% |
Embed
Paste this where you want the figure. It resizes itself and always shows the current version.
Three very different voting days
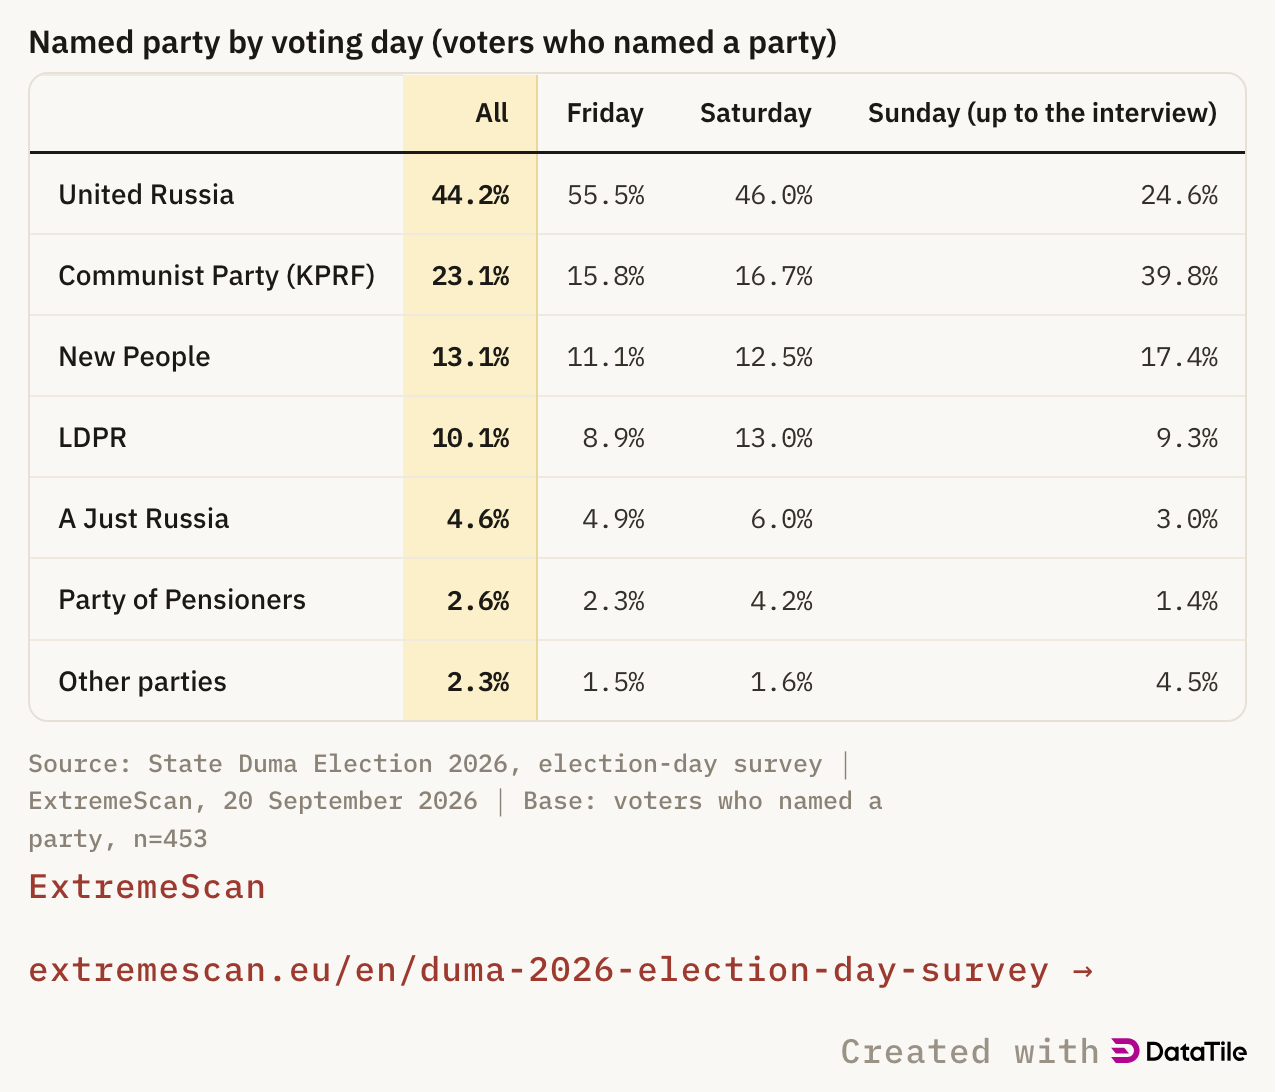
Among the 453 voters who named a party, United Russia received 44%, the Communist Party 23%, New People 13%, LDPR 10% and A Just Russia 5%. We give these figures for completeness, not as a result: they describe the half of the electorate that chose to speak.
What they do show unambiguously is when each party’s voters went to the polls.
Named party by voting day (voters who named a party)
| All | Friday | Saturday | Sunday (up to the interview) | |
|---|---|---|---|---|
| United Russia | 44.2% | 55.5% | 46.0% | 24.6% |
| Communist Party (KPRF) | 23.1% | 15.8% | 16.7% | 39.8% |
| New People | 13.1% | 11.1% | 12.5% | 17.4% |
| LDPR | 10.1% | 8.9% | 13.0% | 9.3% |
| A Just Russia | 4.6% | 4.9% | 6.0% | 3.0% |
| Party of Pensioners | 2.6% | 2.3% | 4.2% | 1.4% |
| Other parties | 2.3% | 1.5% | 1.6% | 4.5% |
Embed
Paste this where you want the figure. It resizes itself and always shows the current version.
On Friday United Russia took a majority of the disclosed votes. On Sunday, one in four, while the Communist Party and New People together took more than half. LDPR held around a tenth every day. Refusal did not vary by day, so this is not an artefact of willingness to talk.
A timetable of electorates: the election segmented
Put the three tables together and the election acquires a structure. The Friday electorate is the state sector, voting online or however suits the employer, and mostly for United Russia. The Sunday electorate is polling-station voters, the private sector and the self-employed, and mostly a protest vote. In Russia’s wartime parties we described the United Russia electorate as the party of beneficiaries and protected status, the Communist electorate as channelled social discontent, and the New People electorate as a modernising middle class constrained by the war. Here those segments have shown up as a timetable.
Do Russians expect an honest count?
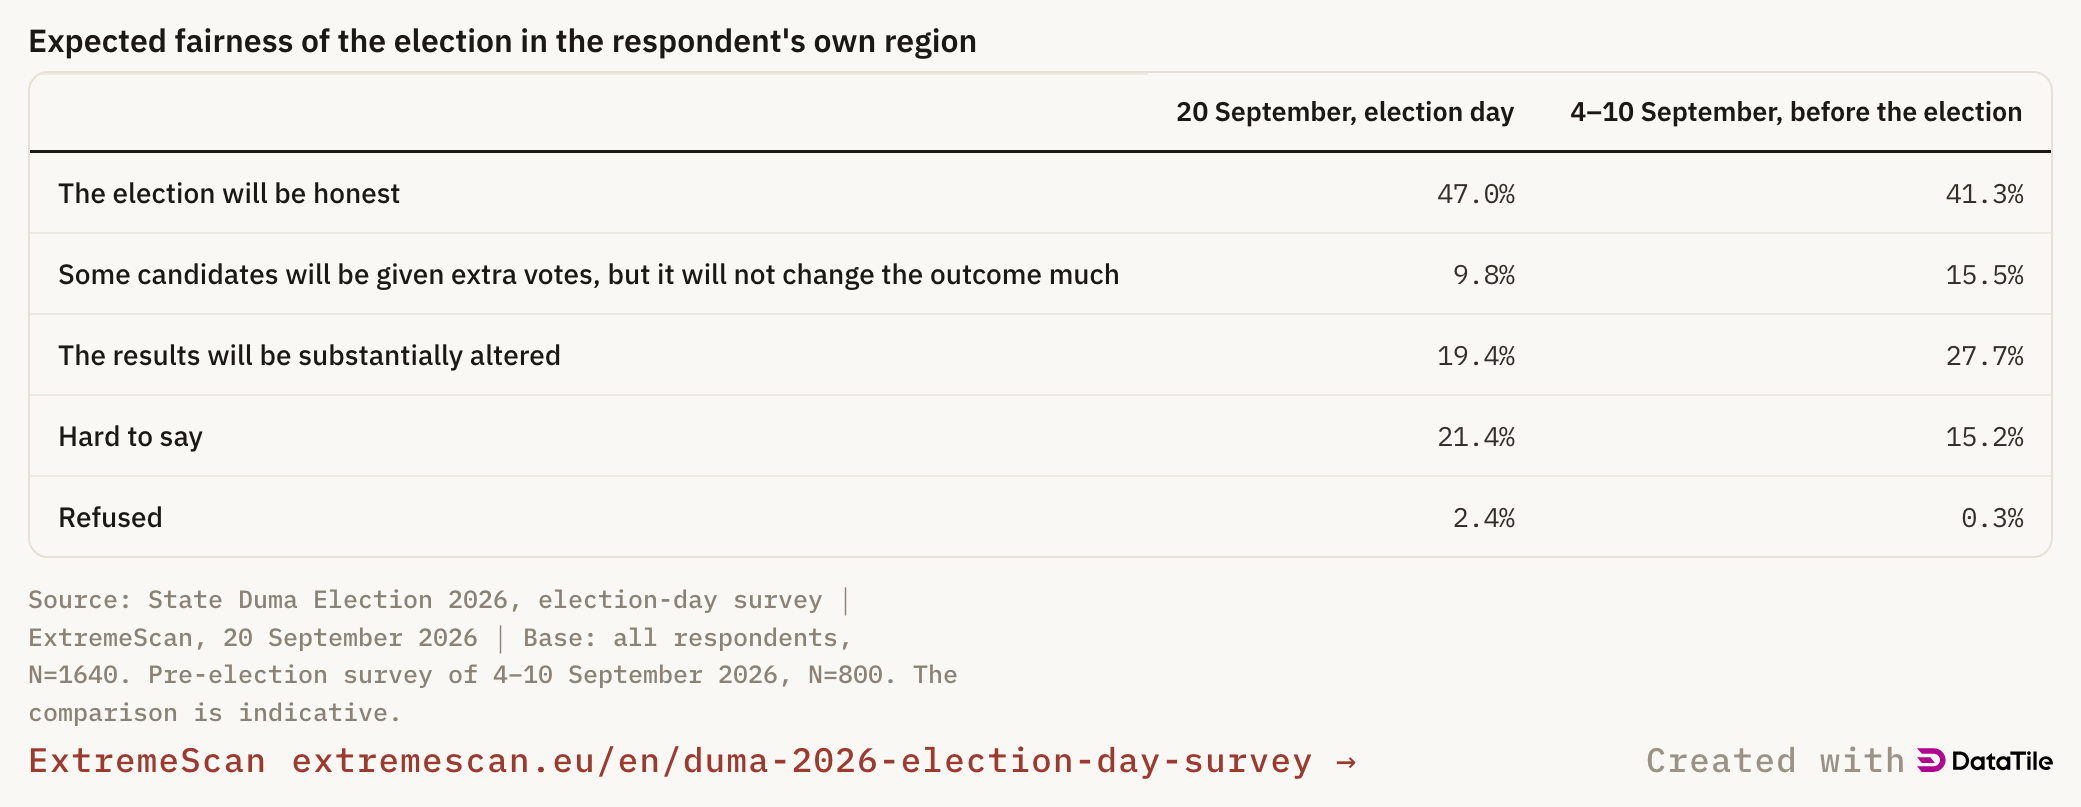
Respondents were asked: “Do you think the election where you live will be conducted honestly, or will some candidates and parties be given extra votes?”
Expected fairness of the election in the respondent's own region
| 20 September, election day | 4–10 September, before the election | |
|---|---|---|
| The election will be honest | 47.0% | 41.3% |
| Some candidates will be given extra votes, but it will not change the outcome much | 9.8% | 15.5% |
| The results will be substantially altered | 19.4% | 27.7% |
| Hard to say | 21.4% | 15.2% |
| Refused | 2.4% | 0.3% |
Embed
Paste this where you want the figure. It resizes itself and always shows the current version.
47% expected an honest count where they live, 29% expected vote-padding, minor or substantial, and 21% could not answer. Compared with the pre-election survey, fewer expect the results to be substantially altered and more avoid a judgement (41% honest, 43% padded, 15% hard to say). Part of this is sample composition: voters expect honesty more often (53%) than those who will not vote (30%), and this sample is skewed towards voters.
In the pre-election survey the same question asked about Russia as a whole gave less optimistic figures: 31% honest, 56% padded, 13% hard to say.
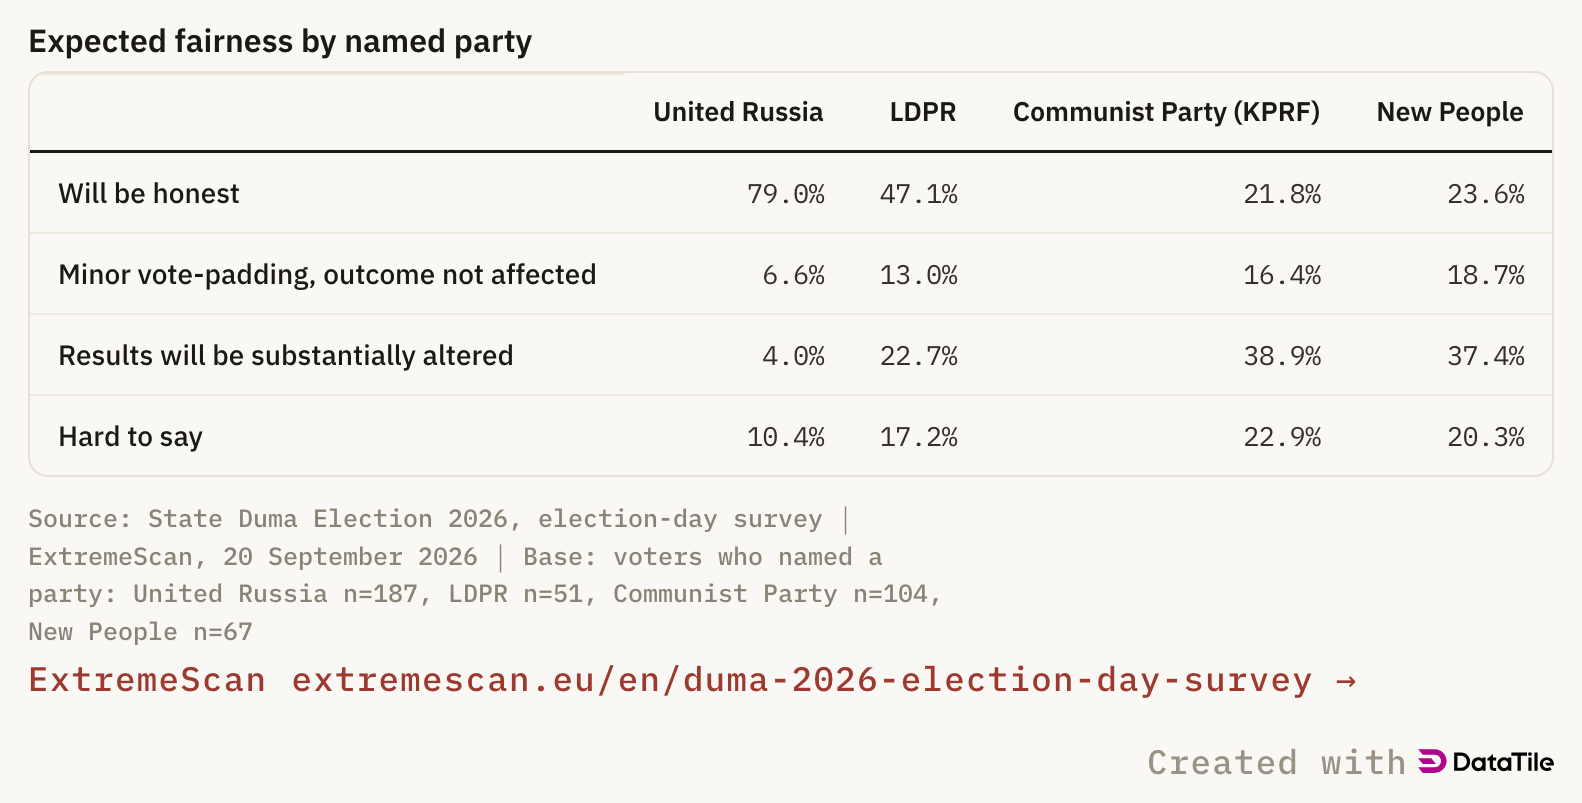
The answer depends on the party preference of the electorate: 79% of United Russia voters expect an honest count and 4% expect the results to be substantially altered. Among Communist voters the figures are 22% and 39%; among New People voters, 24% and 37%.
Expected fairness by named party
| United Russia | LDPR | Communist Party (KPRF) | New People | |
|---|---|---|---|---|
| Will be honest | 79.0% | 47.1% | 21.8% | 23.6% |
| Minor vote-padding, outcome not affected | 6.6% | 13.0% | 16.4% | 18.7% |
| Results will be substantially altered | 4.0% | 22.7% | 38.9% | 37.4% |
| Hard to say | 10.4% | 17.2% | 22.9% | 20.3% |
Embed
Paste this where you want the figure. It resizes itself and always shows the current version.
Trust in the count also follows the source of information: 62% of federal-TV viewers expect an honest count and 9% expect the results to be substantially altered; among the non-state media audience the figures are 35% and 32%.
Administrative pressure
This survey carried two new questions. Had the respondent’s management strongly recommended voting for particular candidates or parties? And, in regions with electronic voting, had management strongly recommended registering for online voting?
6% of all respondents reported the first. The share is almost the same in the state sector (7%) and among private-sector employees (8%).
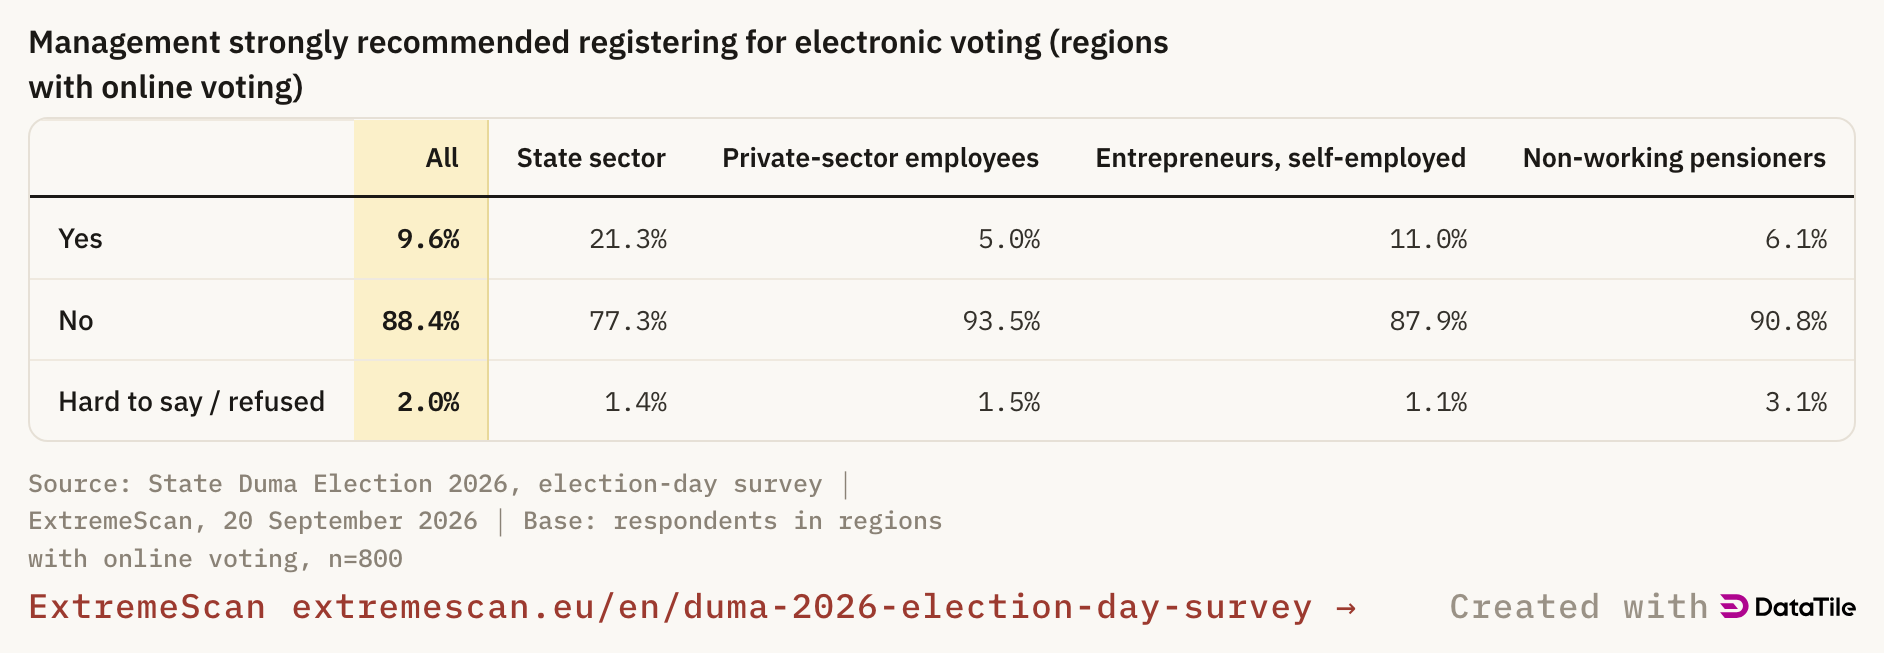
The second is a state-sector phenomenon. In regions with online voting, 21% of state-sector employees said management had strongly recommended that they register, against 5% of private-sector employees and 11% of entrepreneurs and the self-employed.
Management strongly recommended registering for electronic voting (regions with online voting)
| All | State sector | Private-sector employees | Entrepreneurs, self-employed | Non-working pensioners | |
|---|---|---|---|---|---|
| Yes | 9.6% | 21.3% | 5.0% | 11.0% | 6.1% |
| No | 88.4% | 77.3% | 93.5% | 87.9% | 90.8% |
| Hard to say / refused | 2.0% | 1.4% | 1.5% | 1.1% | 3.1% |
Embed
Paste this where you want the figure. It resizes itself and always shows the current version.
62% of electronic votes were cast on Friday. The administratively dependent voter of 2026 is told not so much whom to choose as when and how to vote.
The wording “strongly recommended” sets a high bar; softer forms of pressure are not captured, so these are lower-bound estimates.
What the survey showed
-
More than half of voters — 53% — did not name the party they had voted for. In our survey on the day of the 2024 presidential election that share was 37%, and just a week before this election 17% would not name the choice they were about to make. The reasons may differ — from caution and a sense that political behaviour is being monitored, to simple unwillingness to disclose a personal choice. For some voters the non-answer may have become a way of protecting political privacy: “I voted. Whom for, I will not say.” Redistributing these 53% to any party is therefore not justified by the data.
-
The election had two electorates, divided by the calendar. Among those who disclosed their choice, Friday belonged to the state sector, electronic voting and United Russia, which took 55% of the disclosed Friday votes. Sunday belonged to polling-station voters, the private sector and the self-employed; the Communist Party and New People together took 57% of the disclosed Sunday votes, and United Russia 25%.
-
The Friday mobilisation of state-sector employees recurred. In 2024, 60% of state-sector employees voted on Friday; in 2026, 58%. It now runs closely alongside electronic voting: one in five state-sector employees in regions with online voting was told by management to register for it. 6% reported a direct recommendation to vote for a particular party — roughly the same in every sector. Administrative pressure shows up above all in control over participation, timing and method of voting, not necessarily over party choice.
-
Attitudes to the honesty of the count differ sharply between electorates. Overall, 47% expect an honest count where they live and 29% expect minor or substantial vote-padding. Among United Russia voters 79% expect an honest count; among those who named the Communist Party or New People, only 22–24%. Different party electorates thus differ not only in the party they choose but in how they perceive the electoral system itself.
-
This was an election of heightened political importance. It was held after 4.5 years of war — against a background of accumulated fatigue, many everyday problems, falling ratings for United Russia and a growing demand for peace. Unlike the 2024 presidential election, the parliamentary campaign was less predictable. At a moment when the war is approaching its next phase, this election had not merely to form a Duma for the next five years but to confirm the durability of the existing political construction. It was an operation to reinforce the concentration of power at a time when the social cost of continuing the war is rising and its further trajectory is becoming ever less predictable.
Methodology
Fieldwork: 20 September 2026, 08:00–20:46 Moscow time, the third of three voting days. Method: telephone survey, mobile numbers (RDD), 3-minute questionnaire. Geography: Russian Federation, all federal districts. Sample: 1640 residents of Russia aged 18 and over; 980 reported having voted. Weighting: by federal district, sex, age and type of settlement (urban/rural). Margin of error: ±2.6 pp for the full sample and ±3.3 pp for voters at the 95% confidence level, allowing for the design effect of weighting.
Interviewers rated 9% of respondents as closed and wary, 74% as quite open and 17% as very open.