Party preferences of Russians ahead of the State Duma election
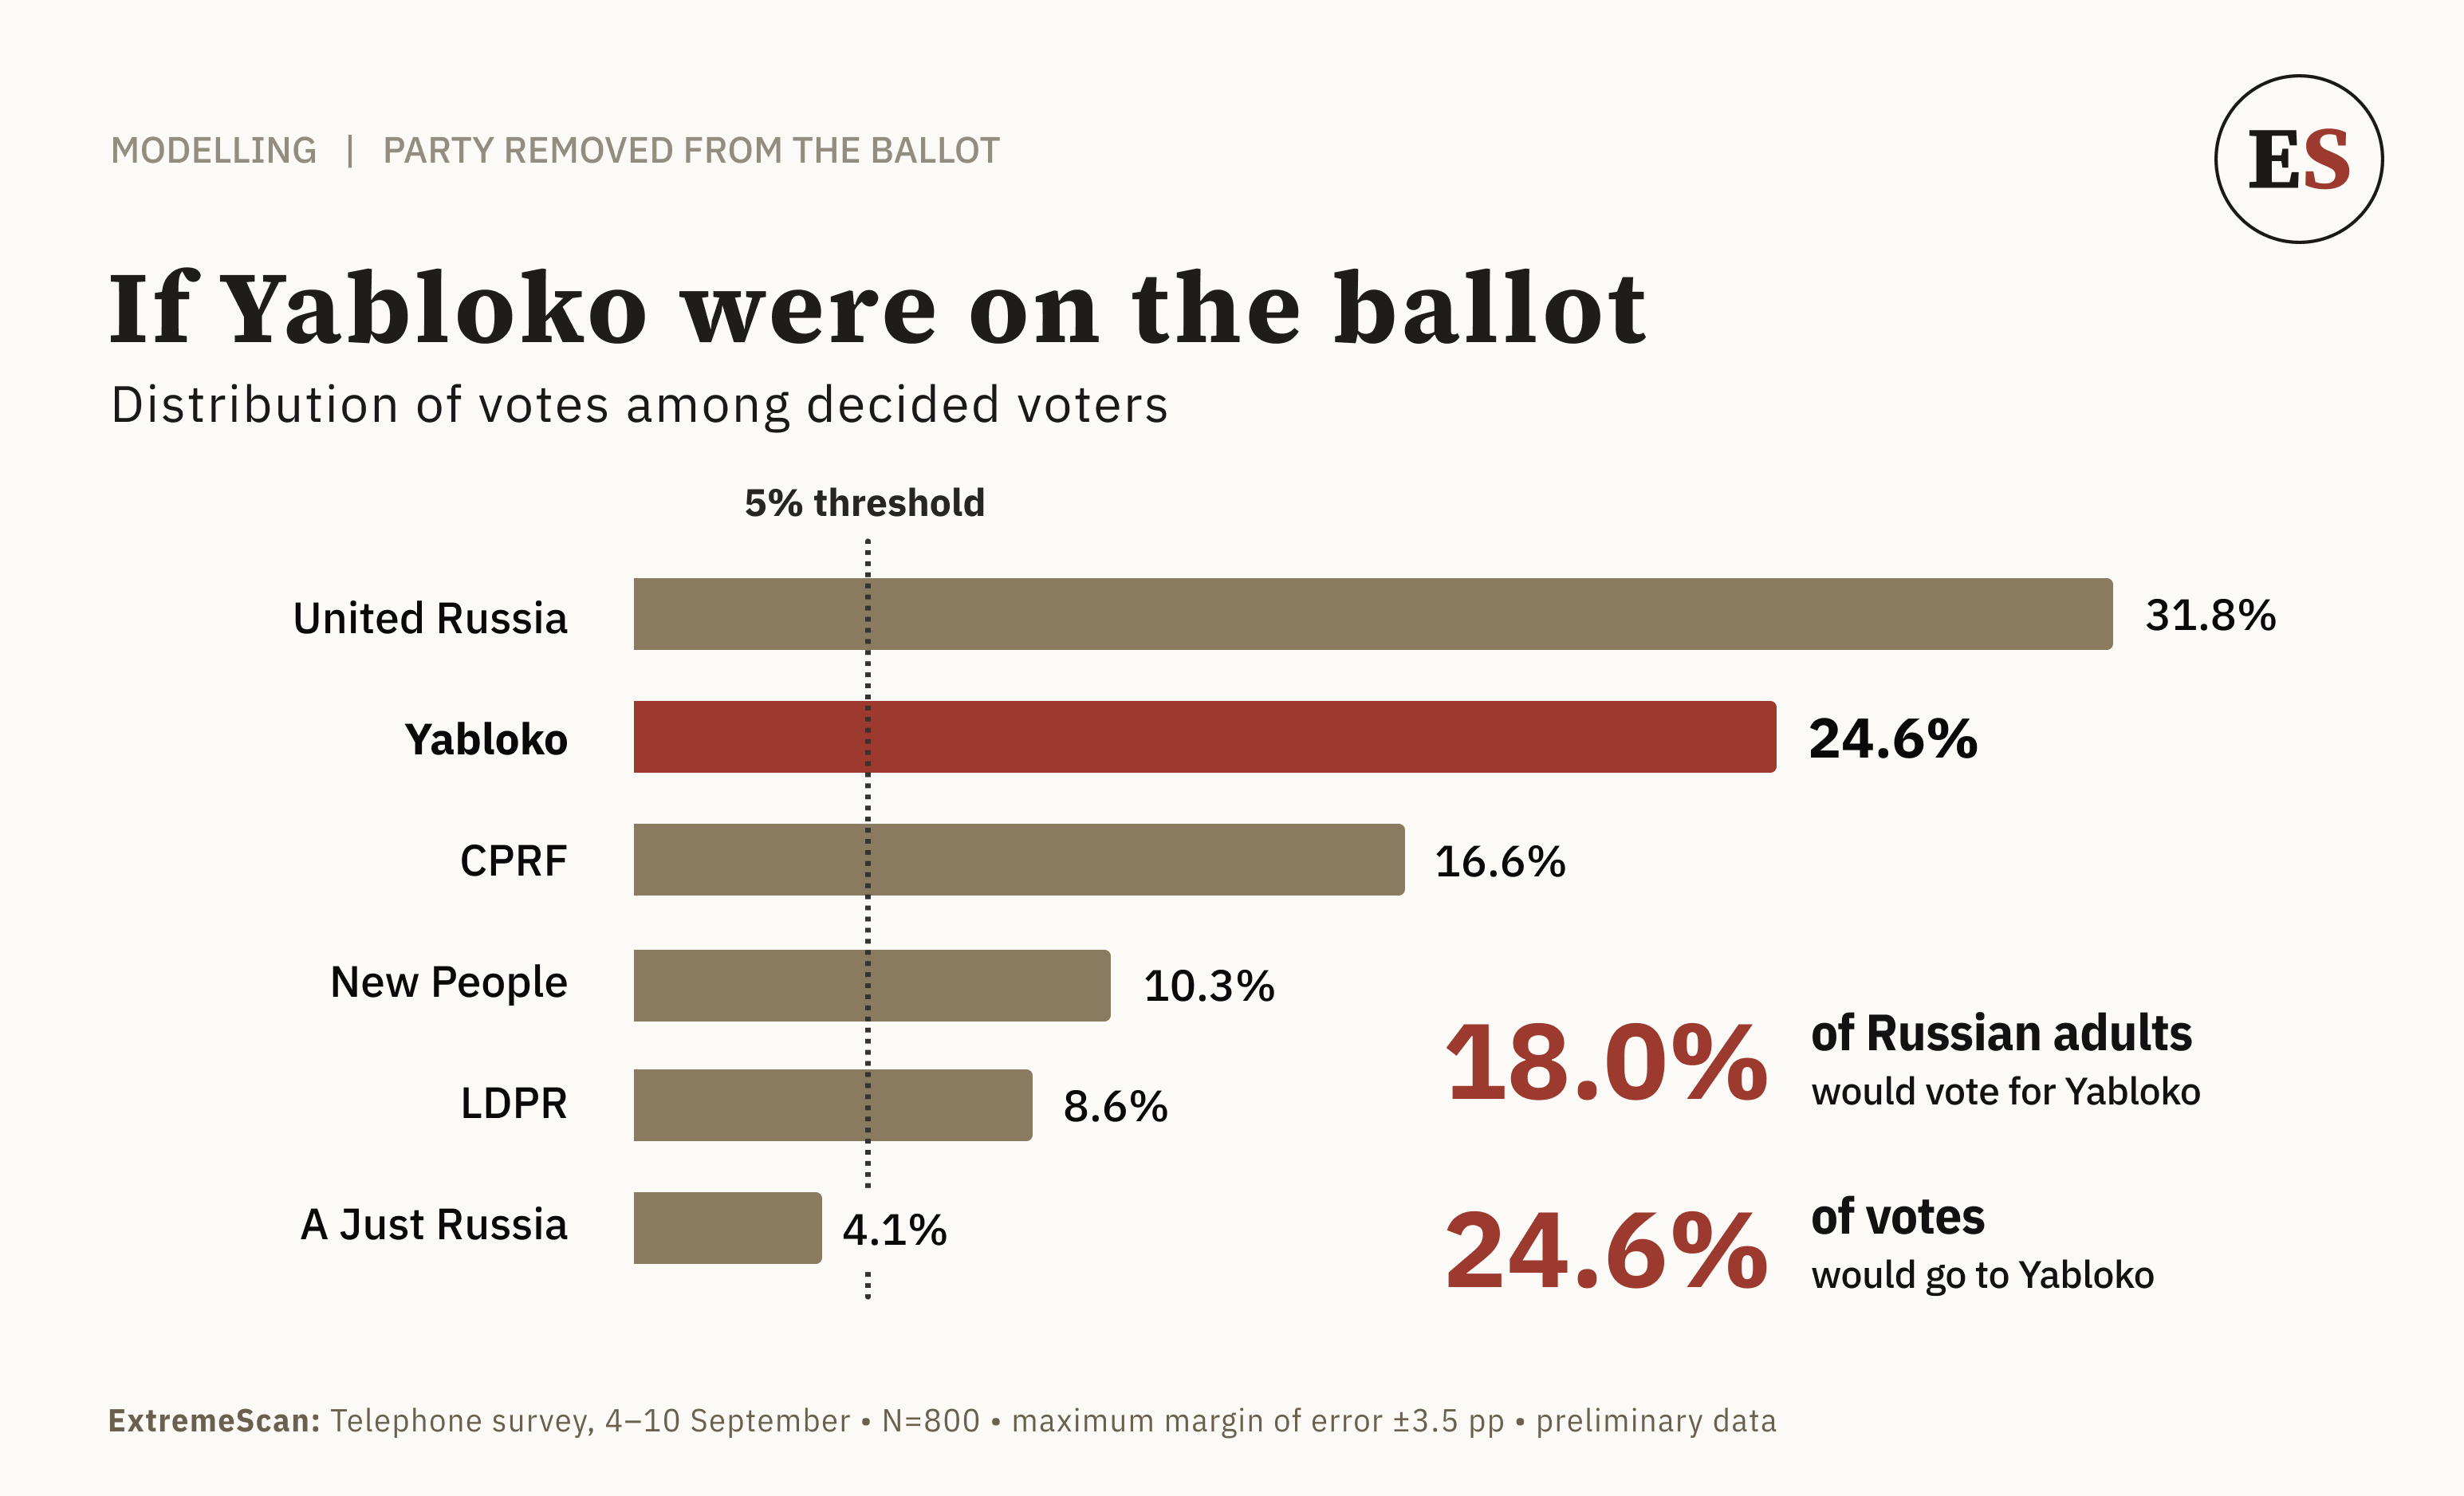
Interim results of an ExtremeScan telephone survey conducted on 4–10 September 2026, a week before the State Duma election. 800 of a planned 1,600 respondents have been interviewed. The report covers party standings, expectations of the election and assessments of the outgoing Duma, together with a modelled share for Yabloko, the party barred from the ballot: 18.0% of adult Russians would vote for it — 24.6% of those who have made up their minds.
The State Duma election will be held on 18–20 September 2026. ExtremeScan conducted a telephone survey of Russian residents on 4–10 September. What follows are interim results on a sample of 800 respondents out of a planned 1,600; the full report will be published after the election.
97.3% of respondents know of the coming election or have heard something about it.
The data are published without comparison to the results of other research organisations.
Party standings
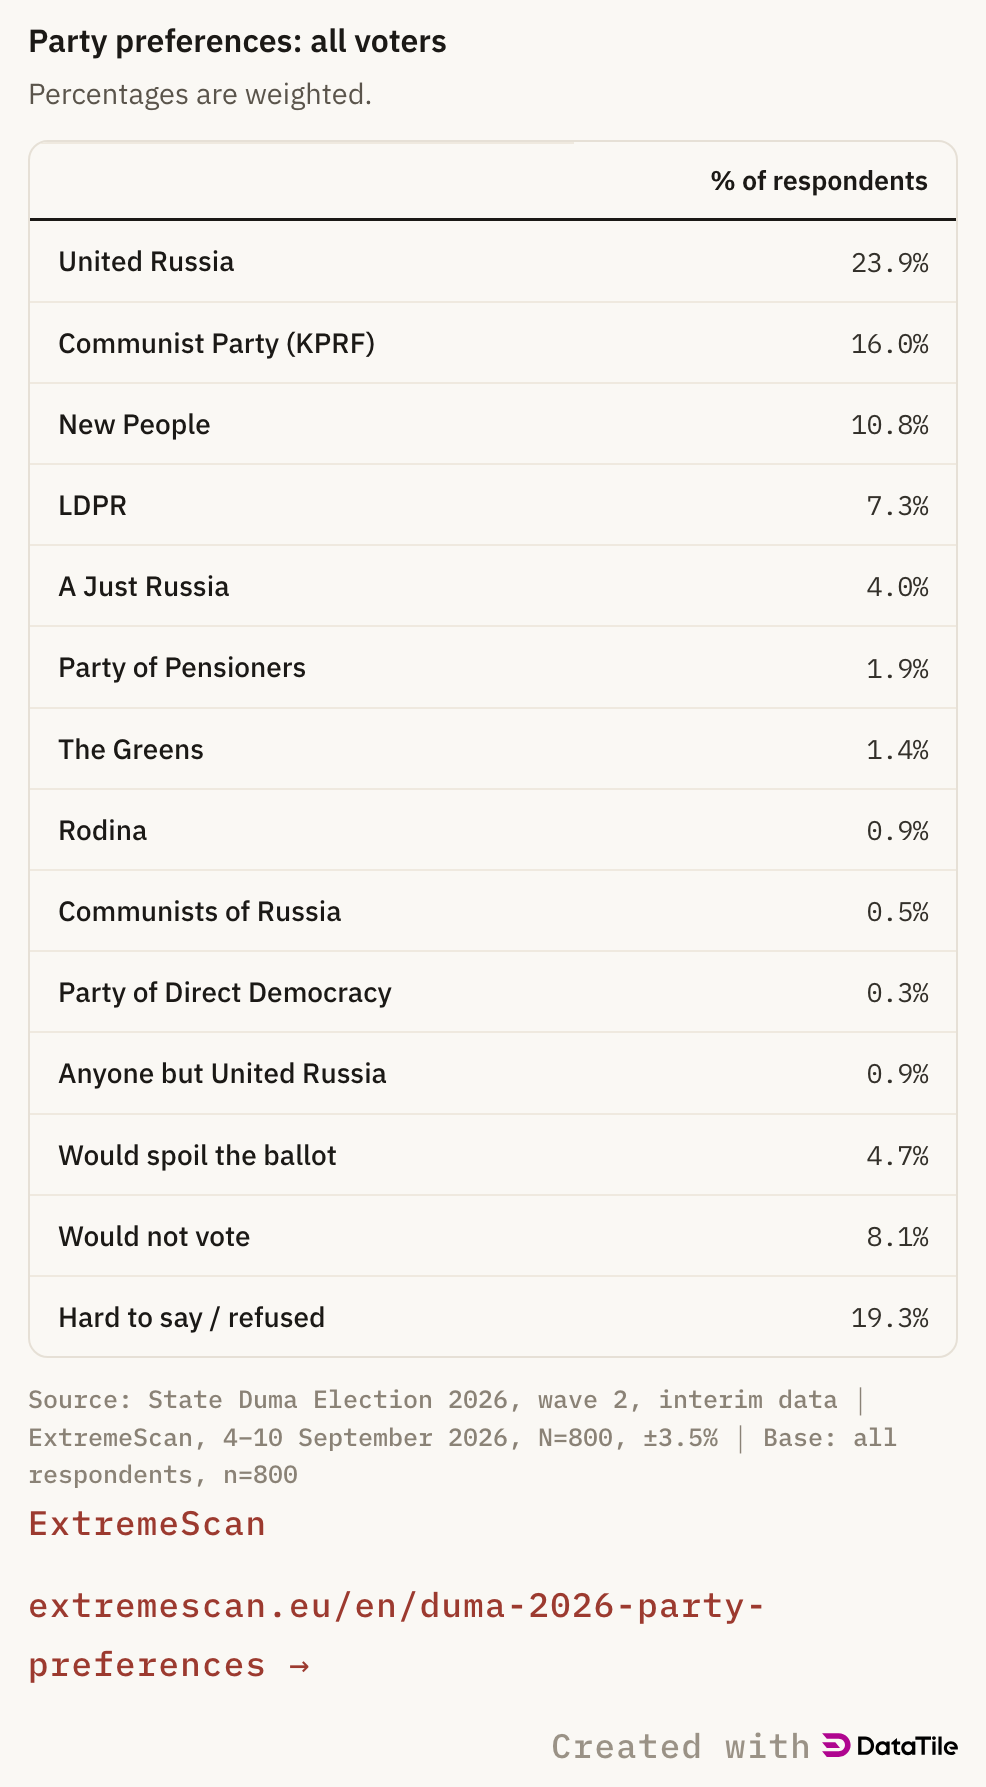
67% of respondents named a party they are ready to vote for (n=544). A further 19.3% found it hard to answer or refused, 8.1% will not vote, 4.7% will spoil their ballot, and 0.9% will vote “anyone but United Russia”.
Party preferences: all voters
Percentages are weighted.
| % of respondents | |
|---|---|
| United Russia | 23.9% |
| Communist Party (KPRF) | 16.0% |
| New People | 10.8% |
| LDPR | 7.3% |
| A Just Russia | 4.0% |
| Party of Pensioners | 1.9% |
| The Greens | 1.4% |
| Rodina | 0.9% |
| Communists of Russia | 0.5% |
| Party of Direct Democracy | 0.3% |
| Anyone but United Russia | 0.9% |
| Would spoil the ballot | 4.7% |
| Would not vote | 8.1% |
| Hard to say / refused | 19.3% |
Embed
Paste this where you want the figure. It resizes itself and always shows the current version.

Four of the ten parties have fewer than eleven respondents each, and the Party of Direct Democracy has one: their shares are given for completeness of the distribution and carry no standalone meaning.
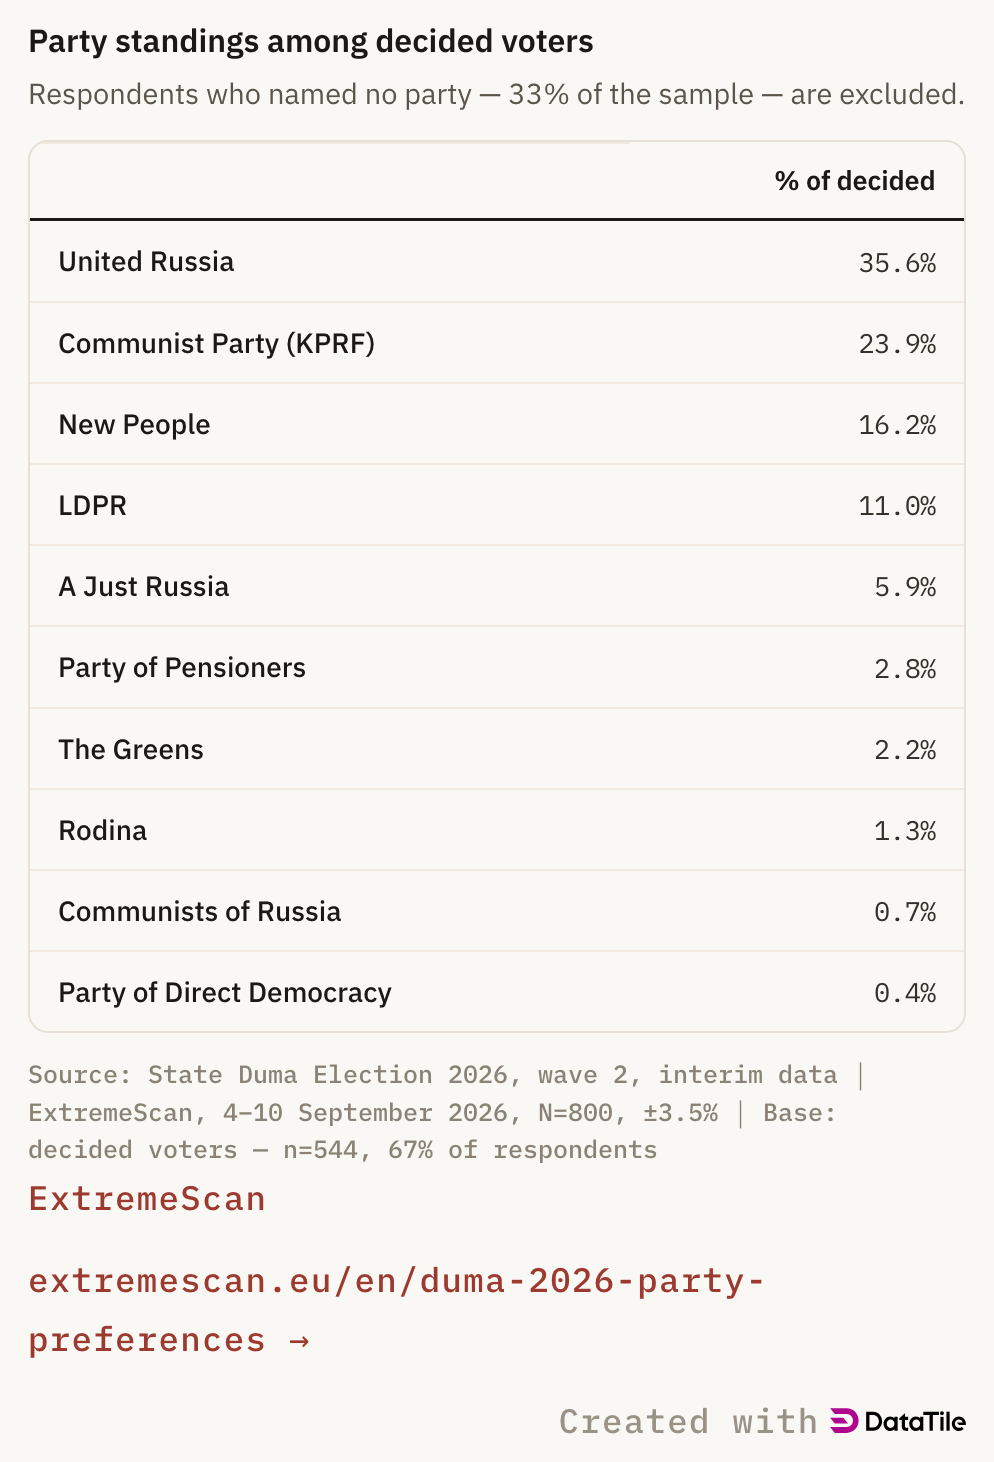
Party standings among decided voters
Respondents who named no party — 33% of the sample — are excluded.
| % of decided | |
|---|---|
| United Russia | 35.6% |
| Communist Party (KPRF) | 23.9% |
| New People | 16.2% |
| LDPR | 11.0% |
| A Just Russia | 5.9% |
| Party of Pensioners | 2.8% |
| The Greens | 2.2% |
| Rodina | 1.3% |
| Communists of Russia | 0.7% |
| Party of Direct Democracy | 0.4% |
Embed
Paste this where you want the figure. It resizes itself and always shows the current version.
Five parties clear the 5% threshold on these data.
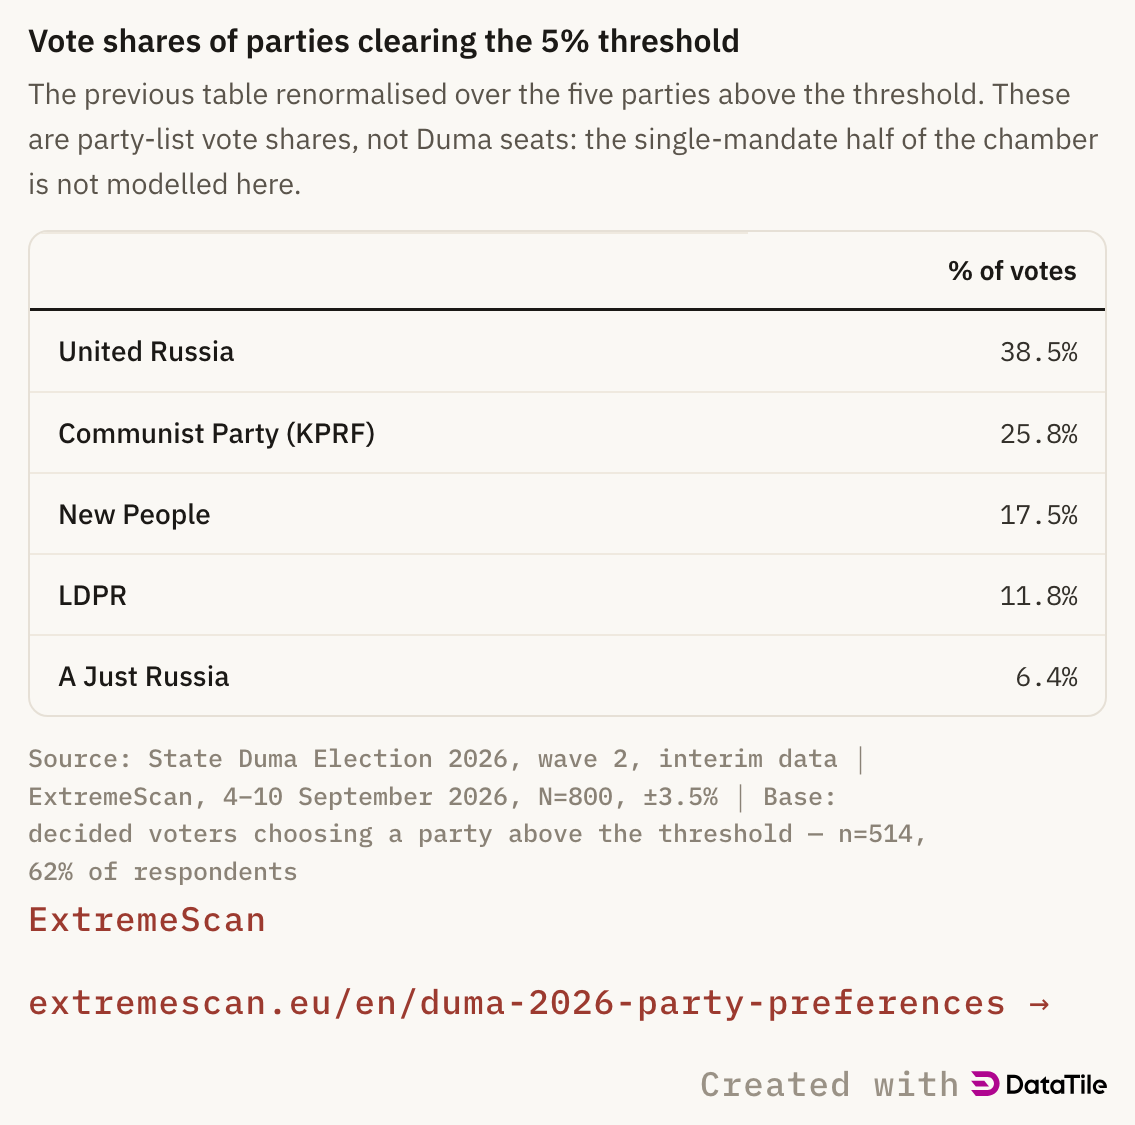
Vote shares of parties clearing the 5% threshold
The previous table renormalised over the five parties above the threshold. These are party-list vote shares, not Duma seats: the single-mandate half of the chamber is not modelled here.
| % of votes | |
|---|---|
| United Russia | 38.5% |
| Communist Party (KPRF) | 25.8% |
| New People | 17.5% |
| LDPR | 11.8% |
| A Just Russia | 6.4% |
Embed
Paste this where you want the figure. It resizes itself and always shows the current version.
These are party-list vote shares. Half the seats in the State Duma are filled in single-mandate districts, and that half is not modelled here.
Yabloko
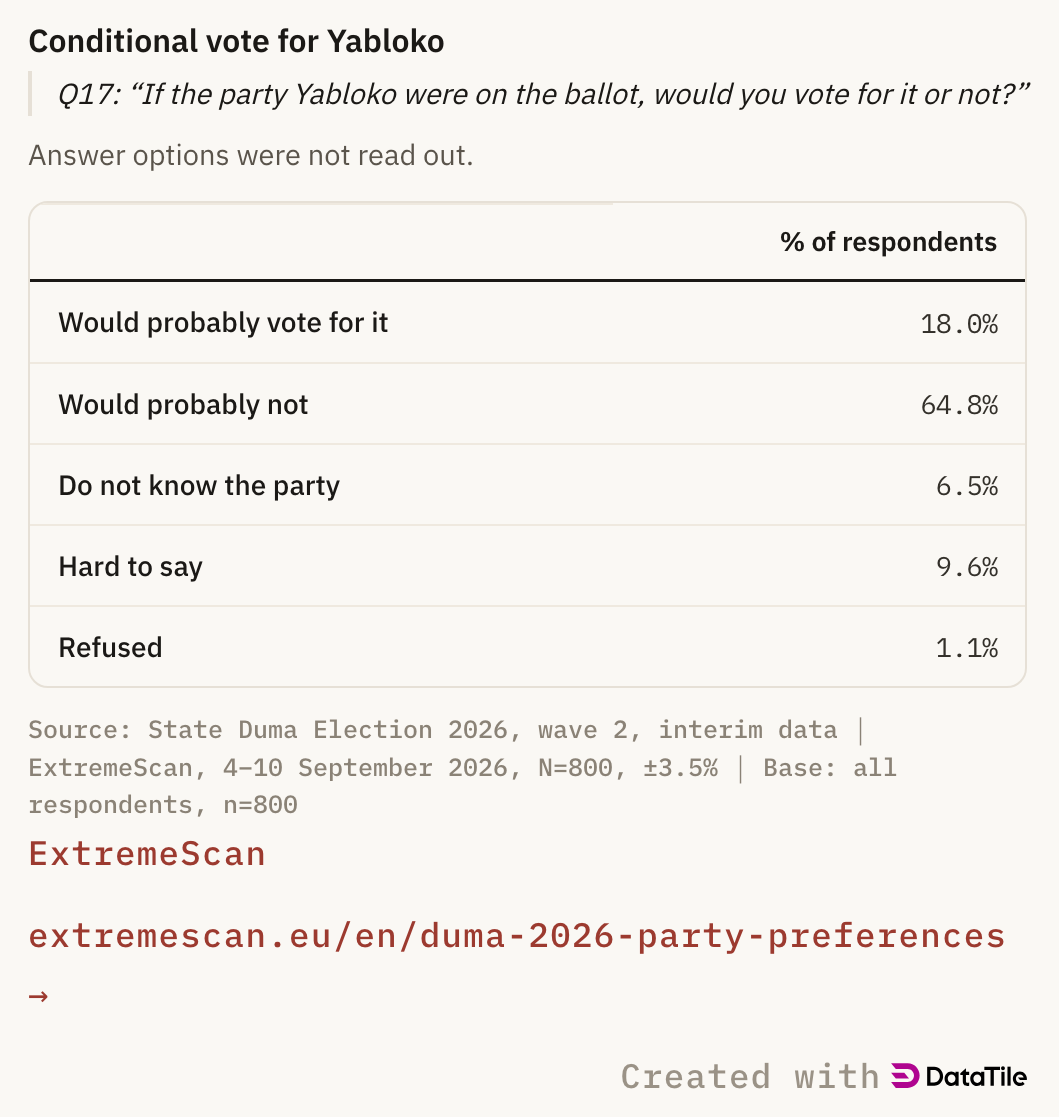
Yabloko has been barred from the election and is absent from the ballot. To estimate its possible share, respondents were asked a separate question. Answer options were not read out.
Conditional vote for Yabloko
Q17: “If the party Yabloko were on the ballot, would you vote for it or not?”
Answer options were not read out.
| % of respondents | |
|---|---|
| Would probably vote for it | 18.0% |
| Would probably not | 64.8% |
| Do not know the party | 6.5% |
| Hard to say | 9.6% |
| Refused | 1.1% |
Embed
Paste this where you want the figure. It resizes itself and always shows the current version.
18.0% answered yes — 141 respondents.
In ExtremeScan’s July survey Yabloko was still on the list of parties read out, taking 4% of all voters and 6% of decided voters. The report published on those data, Russia’s wartime parties, stated: “if a party advocating an end to the war had remained on the ballot, it would have been entirely realistic for it to receive at least 18-20%”.
The rise in Yabloko’s potential support cannot, however, be set directly against the party’s July rating. In July respondents picked Yabloko from the general list of parties, whereas in September they were asked separately whether they might vote for Yabloko if it were running. Presenting the question that way can in itself inflate the measured electoral potential.
But the methodological effect is not the only explanation. Over the intervening months Yabloko ran a full election campaign, which in effect carried on after its removal from the federal list. The refusal to register the party became a major public event in its own right: the Supreme Court ruling, the subsequent appeal and the party’s stated intention to keep challenging the decision were widely covered in the media. The hearings drew the party’s supporters. Public gatherings and rallies outside the Supreme Court building were accompanied by detentions, which made news in turn.
Alongside this ran a series of court disputes and removals of Yabloko candidates from regional elections. All of it kept the party in the public eye.
The content of that publicity matters just as much. Coverage of the campaign and of Yabloko’s removal kept restating the party’s radical distinguishing position — its demand for a ceasefire and an end to the war. The party gained not only additional name recognition but a unique political identity.
Confirmation that both the media effect and the campaign itself worked is that by September recognition of the party was all but universal: only 6.5% of respondents said they did not know of such a party.
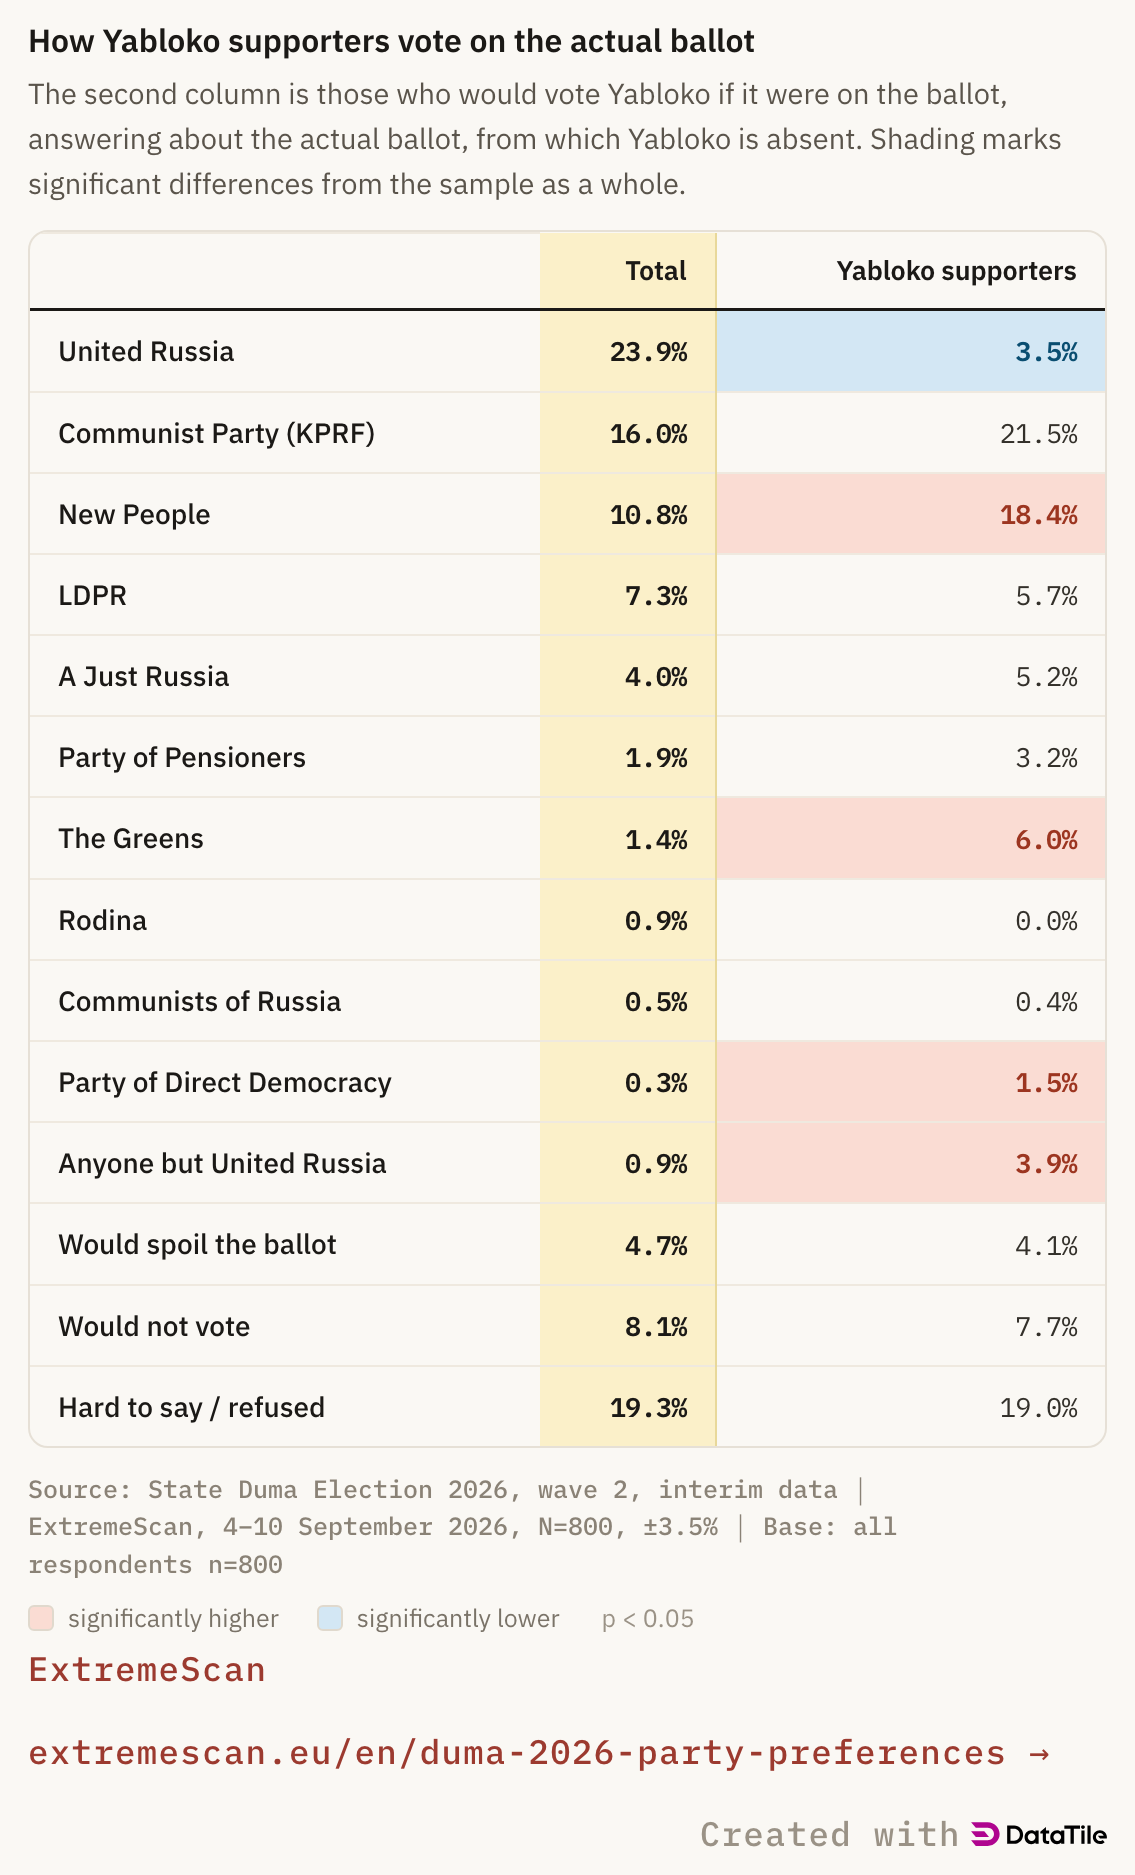
How Yabloko supporters vote on the actual ballot
The second column is those who would vote Yabloko if it were on the ballot, answering about the actual ballot, from which Yabloko is absent. Shading marks significant differences from the sample as a whole.
| Total | Yabloko supporters | |
|---|---|---|
| United Russia | 23.9% | 3.5% |
| Communist Party (KPRF) | 16.0% | 21.5% |
| New People | 10.8% | 18.4% |
| LDPR | 7.3% | 5.7% |
| A Just Russia | 4.0% | 5.2% |
| Party of Pensioners | 1.9% | 3.2% |
| The Greens | 1.4% | 6.0% |
| Rodina | 0.9% | 0.0% |
| Communists of Russia | 0.5% | 0.4% |
| Party of Direct Democracy | 0.3% | 1.5% |
| Anyone but United Russia | 0.9% | 3.9% |
| Would spoil the ballot | 4.7% | 4.1% |
| Would not vote | 8.1% | 7.7% |
| Hard to say / refused | 19.3% | 19.0% |
significantly highersignificantly lowerp < 0.05
Embed
Paste this where you want the figure. It resizes itself and always shows the current version.
With Yabloko barred, its potential electorate (once the shares are recalculated on respondents who have decided on a party) redistributes above all towards the Communist Party (21.5%) and New People (18.4%).
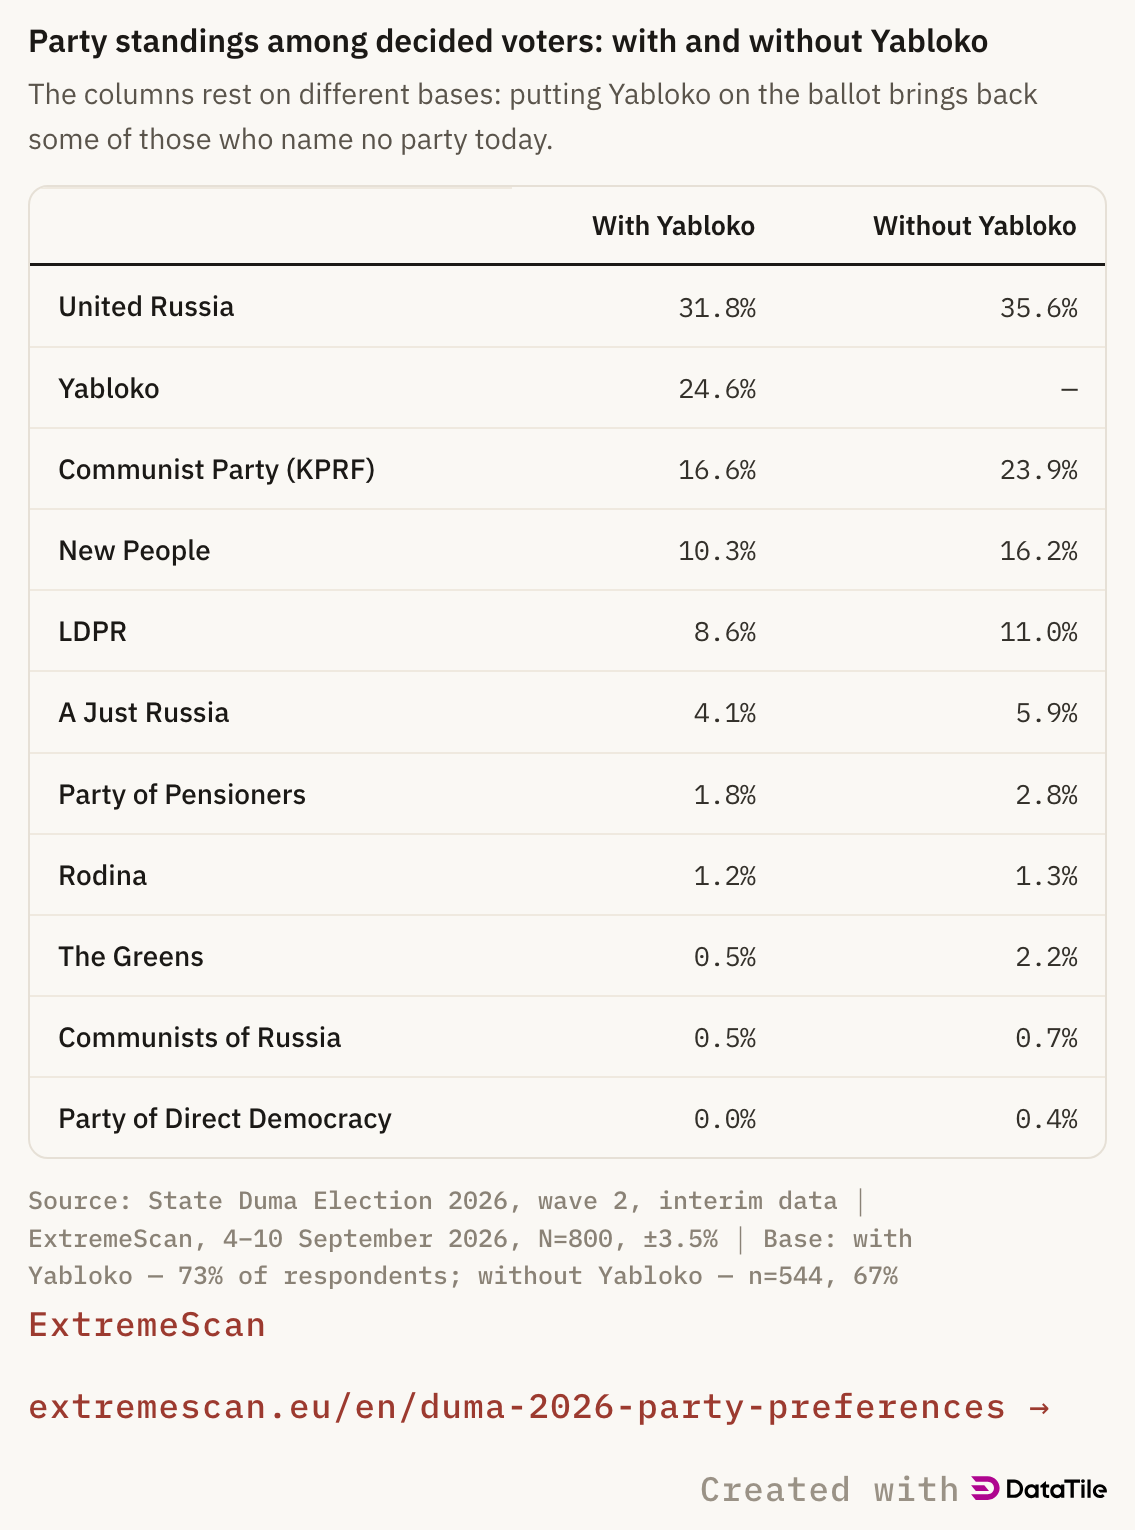
Overall, barring Yabloko improves the standings of every permitted party.
With Yabloko on the ballot the share of decided voters rises from 67% to 73% of respondents: some of those who name no party today return to making a choice.
Party standings among decided voters: with and without Yabloko
The columns rest on different bases: putting Yabloko on the ballot brings back some of those who name no party today.
| With Yabloko | Without Yabloko | |
|---|---|---|
| United Russia | 31.8% | 35.6% |
| Yabloko | 24.6% | — |
| Communist Party (KPRF) | 16.6% | 23.9% |
| New People | 10.3% | 16.2% |
| LDPR | 8.6% | 11.0% |
| A Just Russia | 4.1% | 5.9% |
| Party of Pensioners | 1.8% | 2.8% |
| Rodina | 1.2% | 1.3% |
| The Greens | 0.5% | 2.2% |
| Communists of Russia | 0.5% | 0.7% |
| Party of Direct Democracy | 0.0% | 0.4% |
Embed
Paste this where you want the figure. It resizes itself and always shows the current version.
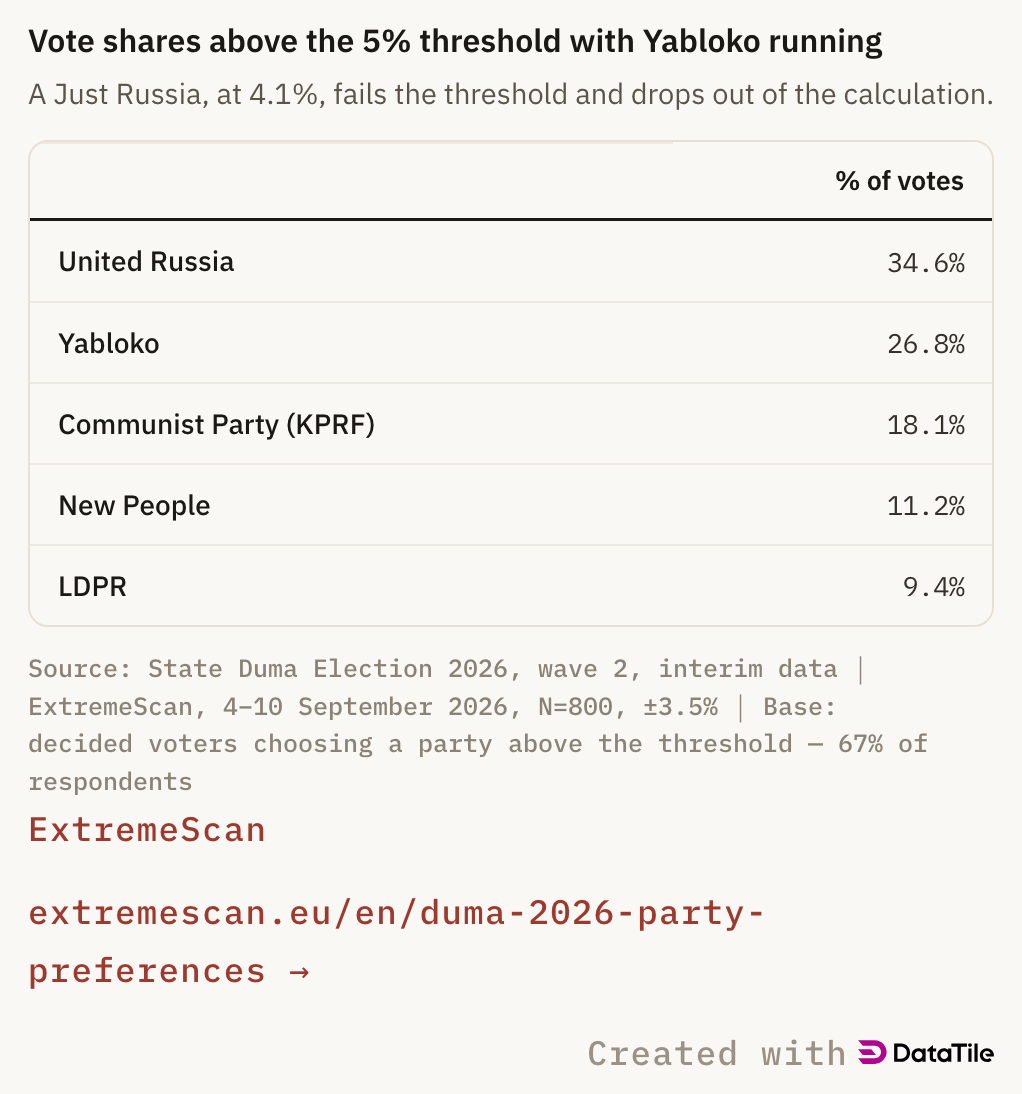
Vote shares above the 5% threshold with Yabloko running
A Just Russia, at 4.1%, fails the threshold and drops out of the calculation.
| % of votes | |
|---|---|
| United Russia | 34.6% |
| Yabloko | 26.8% |
| Communist Party (KPRF) | 18.1% |
| New People | 11.2% |
| LDPR | 9.4% |
Embed
Paste this where you want the figure. It resizes itself and always shows the current version.
In this configuration A Just Russia takes 4.1% and fails the threshold.
The election and the Duma
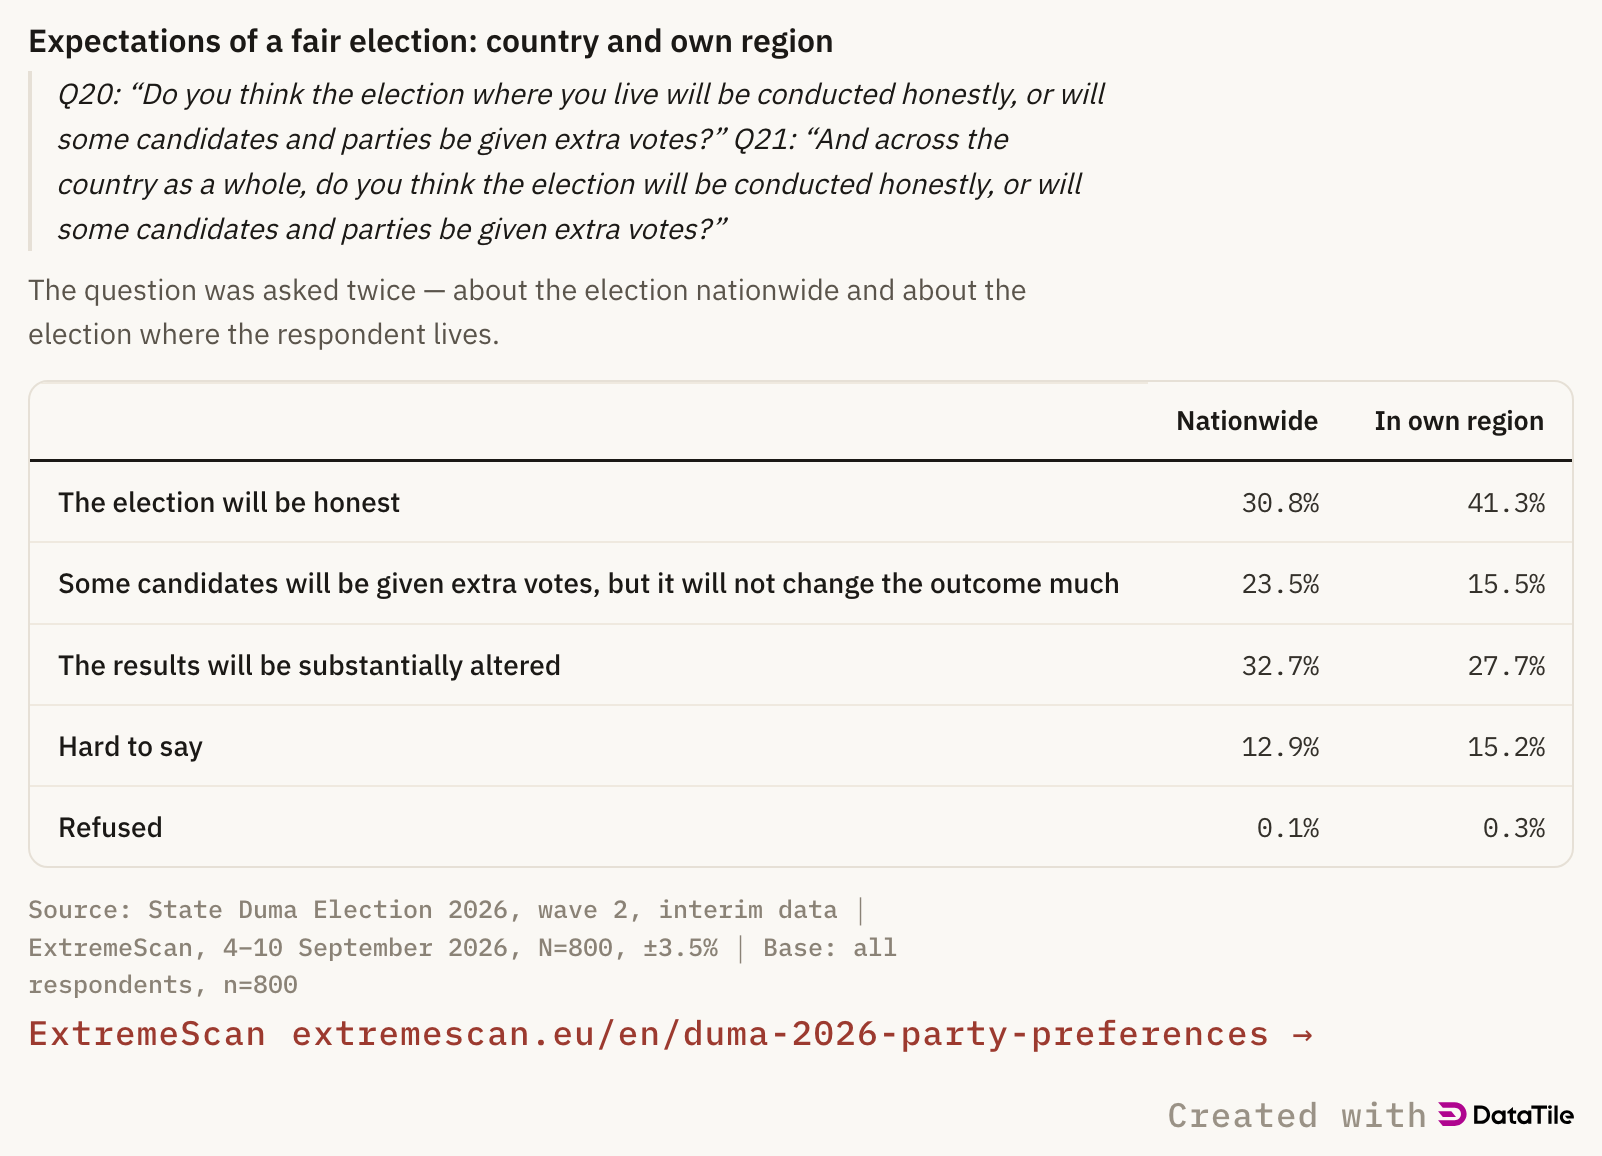
Expectations of a fair election: country and own region
Q20: “Do you think the election where you live will be conducted honestly, or will some candidates and parties be given extra votes?” Q21: “And across the country as a whole, do you think the election will be conducted honestly, or will some candidates and parties be given extra votes?”
The question was asked twice — about the election nationwide and about the election where the respondent lives.
| Nationwide | In own region | |
|---|---|---|
| The election will be honest | 30.8% | 41.3% |
| Some candidates will be given extra votes, but it will not change the outcome much | 23.5% | 15.5% |
| The results will be substantially altered | 32.7% | 27.7% |
| Hard to say | 12.9% | 15.2% |
| Refused | 0.1% | 0.3% |
Embed
Paste this where you want the figure. It resizes itself and always shows the current version.
Assessments diverge markedly depending on whether the question concerns the country or the respondent’s own area: 41.3% expect an honest vote where they live, against 30.8% nationwide.
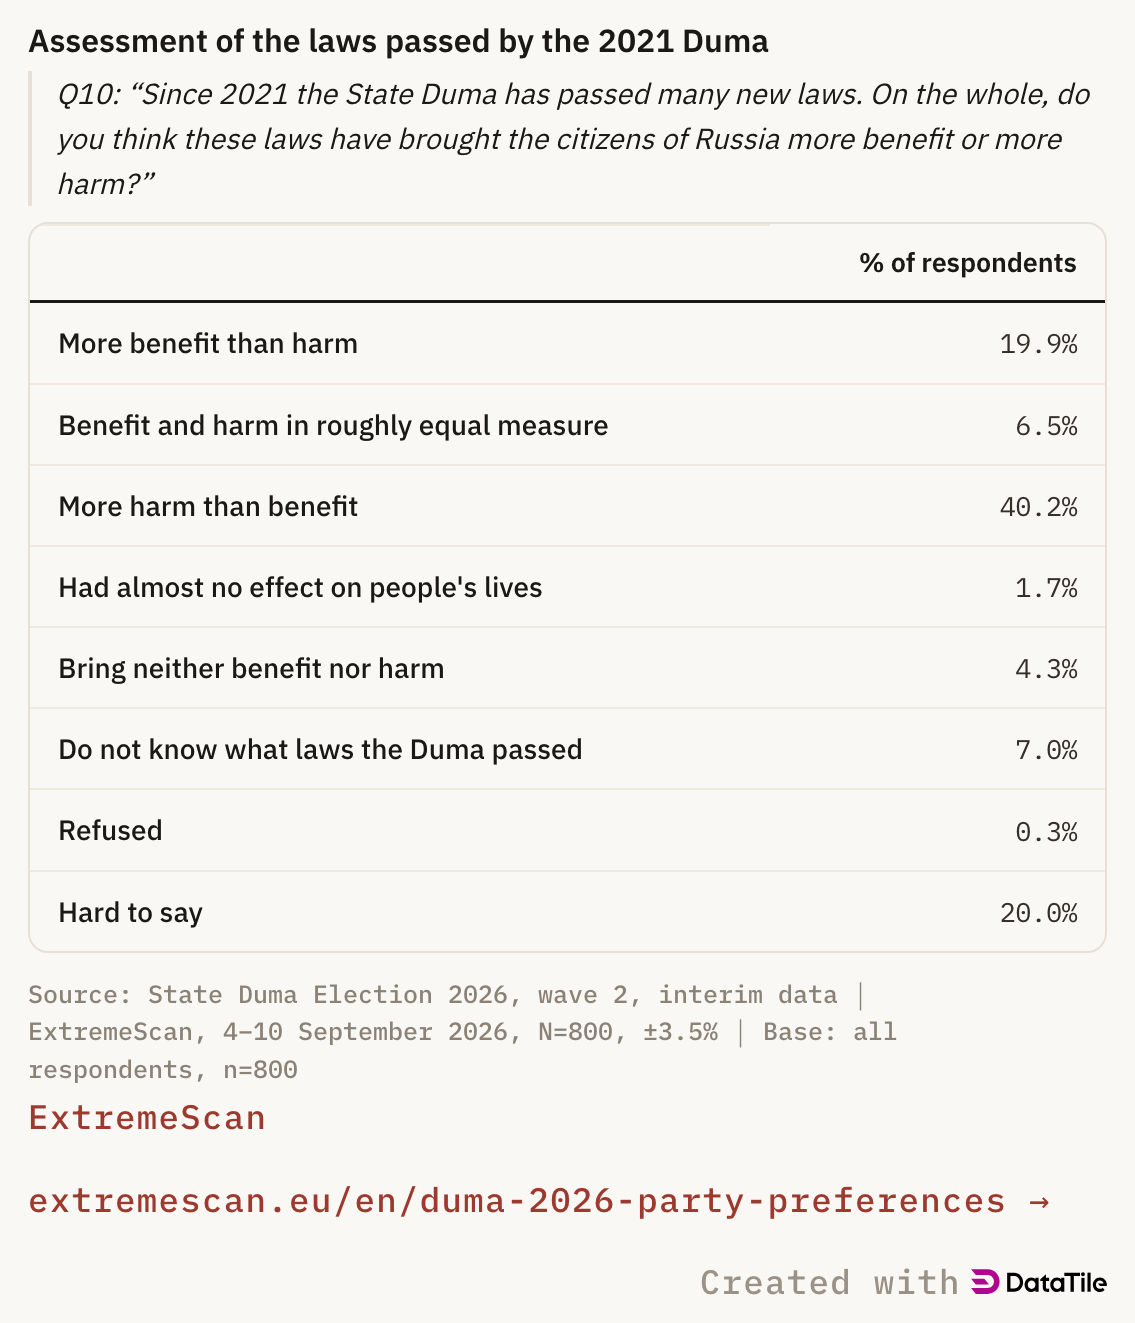
Assessment of the laws passed by the 2021 Duma
Q10: “Since 2021 the State Duma has passed many new laws. On the whole, do you think these laws have brought the citizens of Russia more benefit or more harm?”
| % of respondents | |
|---|---|
| More benefit than harm | 19.9% |
| Benefit and harm in roughly equal measure | 6.5% |
| More harm than benefit | 40.2% |
| Had almost no effect on people's lives | 1.7% |
| Bring neither benefit nor harm | 4.3% |
| Do not know what laws the Duma passed | 7.0% |
| Refused | 0.3% |
| Hard to say | 20.0% |
Embed
Paste this where you want the figure. It resizes itself and always shows the current version.
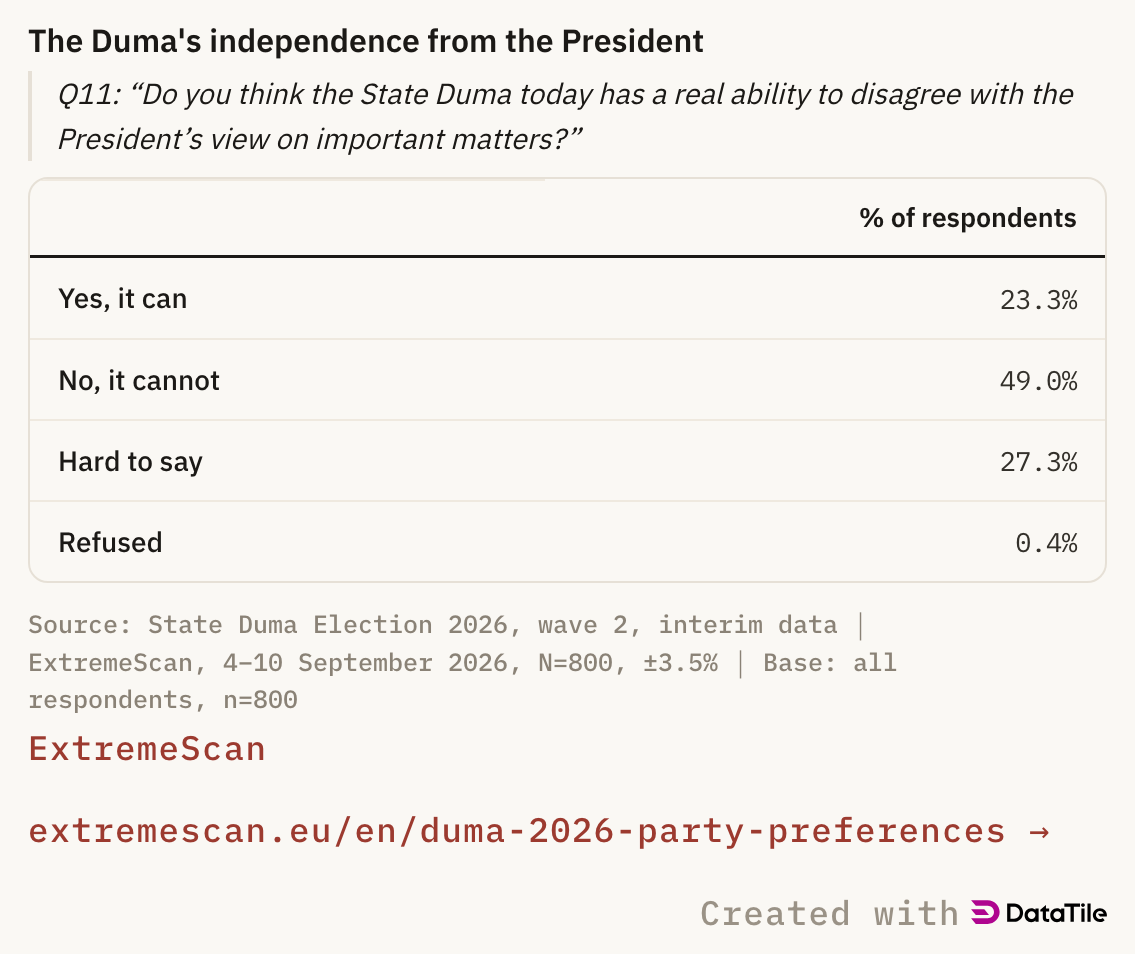
The Duma's independence from the President
Q11: “Do you think the State Duma today has a real ability to disagree with the President’s view on important matters?”
| % of respondents | |
|---|---|
| Yes, it can | 23.3% |
| No, it cannot | 49.0% |
| Hard to say | 27.3% |
| Refused | 0.4% |
Embed
Paste this where you want the figure. It resizes itself and always shows the current version.
Methodology
The survey was conducted from 4 to 10 September 2026 among adult residents of Russia by telephone across all federal districts. The sample size at the time of publication is 800 respondents; the margin of error is ±3.5% at the 95% confidence level. The data are weighted by sex, age and federal subject. The survey was conducted by ExtremeScan on its own initiative.
The “decided” base comprises respondents who named a party in the voting question. The “decided with Yabloko” base comprises those who named a party or answered yes to the Yabloko question.
Fieldwork is continuing. The full report on a sample of 1,600+ respondents will be published after the election.